Step 2: Expand the Network Topology
The next step in creating a power flow model is to expand the network to make a triangular power system. This tutorial will focus on how to navigate the SAInt GUI to design a network. The objective is to learn how to create new branch and node objects, edit objects' properties, interact with the map window to change the network’s topology, and add object labels to display objects' details.
1. Navigate in the map window
The network topology and objects can be moved and manipulated in the map window. This window is located in the center of your screen (referred to in SAInt as the dock panel). Select the electrical line connecting the two nodes and then select a node from either side. Notice that the objects change color when selected and are marked with a magenta color. Objects can be unmarked by pressing Esc. When an object is marked, the object properties are automatically displayed in the property editor window on the right-hand side of the screen.
|
Object properties shown in a blue text can be edited. In contrast, properties in black text are read-only properties that the user cannot edit. Read-only properties are usually derived ones. |
2. Edit object properties
Select the node located on the left side in the map window, named ENO_0, rename it in the property editor under the general category, find the Name property, and edit it to NODE1, as seen below in Figure 1.
Use the same process to rename the node ENO_1 to NODE2.
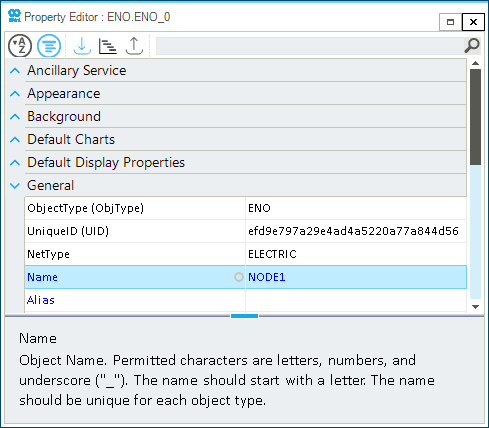
Name.|
Use the description box at the bottom of the property editor window to obtain more details about the different properties. |
3. Add object labels
The label feature in SAInt allows users to visualize information and properties of an object directly in the map window.
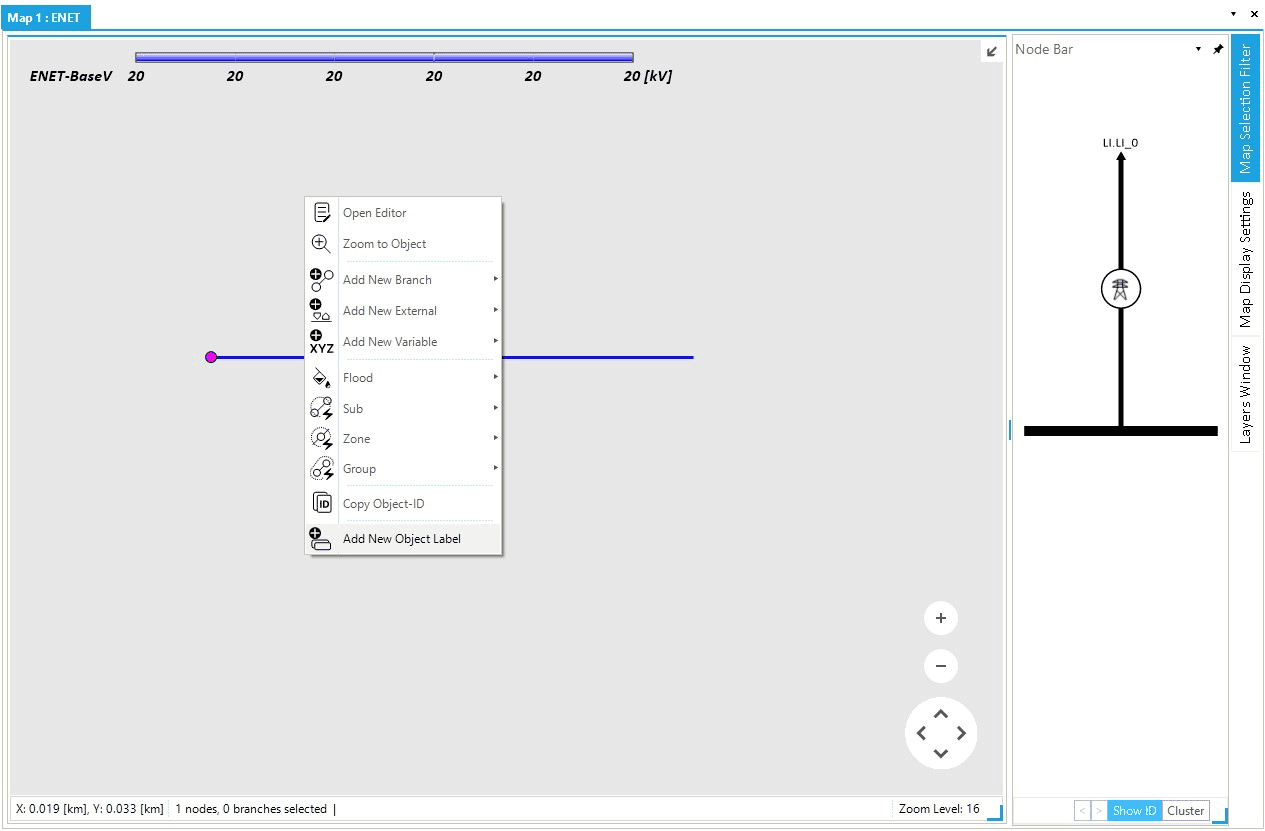
The simplest method to add a label is to right-click on top of an object in the map window and select the Add New Object Label option from the context menu, as shown in Figure 2.
This will automatically create a default object label connected to the object with a dashed black line.
Use this process to generate default labels for both of the nodes.
Default labels show the ID, Name, and Info properties.
The labels can be repositioned by clicking and dragging the box label to the desired position.
|
Note the difference in the color between an active object when you hover over it (pink) and a selected object when you right-click on it (magenta). |
|
Please see the How-to Guides for more information on How-to Add labels and How-to Edit labels in the SAInt GUI. |
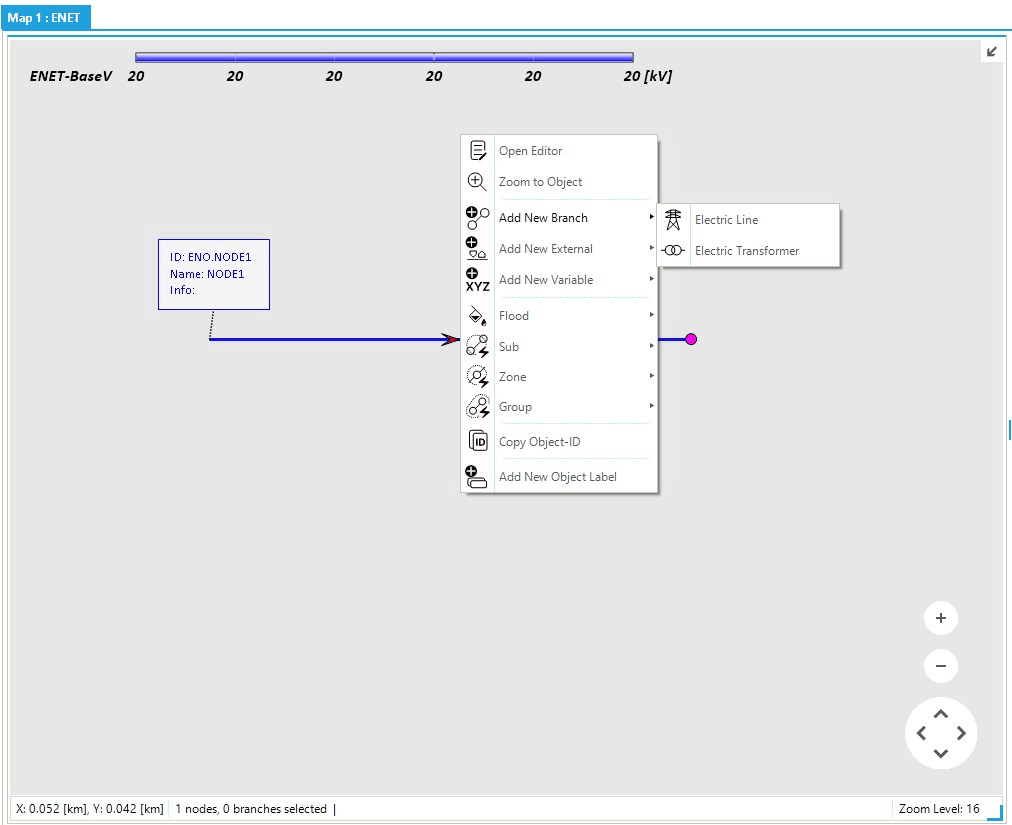
4. Build the network with new objects
Expand the network by creating a new node and branch. Select NODE2 and right-click in a blank area of the map and from the context menu, select , as shown in Figure 3. This procedure will create a new line object connecting NODE2 to the new node location will be the blank area you previously selected. Change the name of the newly created node to NODE3 and move the newly created node above the center of the original line. Once positioned correctly, add a label to NODE3.
|
Nodes can be moved around in the map window by holding down Alt while selecting the node and dragging it around the map window.
Alternatively, the node’s |
The final step to complete the network topology is to add another line connecting NODE3 and NODE1. Using the Shift key in the map window allows you to select multiple objects simultaneously. While NODE3 is marked, hold Shift and select NODE1. Then right-click in the map window and select .
|
Note the order of selecting nodes to create a branch between them defines the branch direction; if you choose first NODE1 and then NODE3, the branch direction will be the opposite. |
5. Customize object labels (optional)
Now, you will edit the labels of all three nodes, mark the three labels (remember to hold Shift), right-click on top of one of the labels, and select the Multi Edit option.
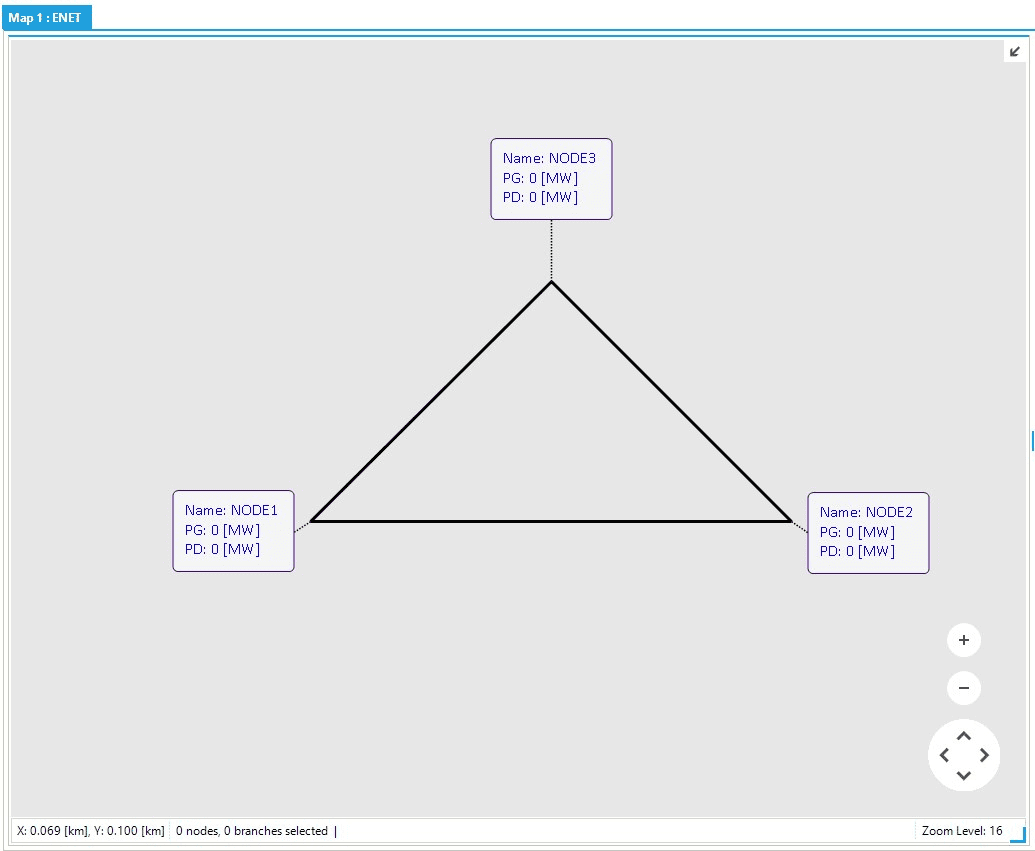
From here, you will edit the label information to display the object name (Name), active power injected/generated (PG), and active power extracted/demanded (PD) by the node.
Change the LabelInfo property in the multi edit window to:
Name: {@.Name}
PG: {@.PG}
PD: {@.PD}
Additionally, the label’s look can be edited by changing the different properties under the background, font, frame, and visibility categories.
Click here for more details about custom node labels.
- Background
-
FillColorto "215, 255, 255". - Font
-
LabelColorto "Black" and LabelFont to "Calibri, 12pt". - Frame
-
StrokeColorto "10, 16, 255",StrokeWidthto 3, and checkLabelFrameVisibleandRoundLabelFrame. - Visibility
-
Make sure that
LabelVisibleis checked and setLabelOpacityto 50.
6. Define object properties using tables
The objects' tables can be used to compare and edit the properties of objects belonging to the same object type.
You will use the electric line object table to edit the properties of lines.
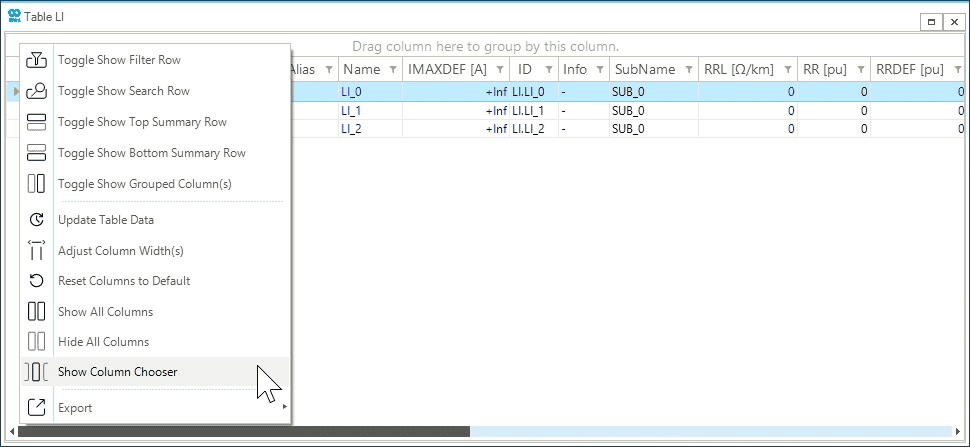
Access the object table by going to the ribbon bar on top of the screen and selecting LI from the electric table gallery.
The object table will open with a set of default properties, right-click on the top right corner of the table window and select the Show Column Chooser option, as shown in Figure 5.
With this, you can add and remove columns from the table.
Add the maximum active power capacity (PMAXDEF) property to the table by searching, dragging, and dropping the column to it.
The opposite process can be used to remove a column from the table to the column chooser window.
Feel free to spend some time editing the table to your liking.
Once the table’s columns have been customized, you can directly set the data of the lines presented in Table 1. Remember you can only edit text which is written in blue.
| Name | Default maximum active power | Defeault resistance per unit | Default reactance per unit |
|---|---|---|---|
|
|
|
|
LINE1 |
100 |
0.01 |
0.02 |
LINE2 |
100 |
0.02 |
0.03 |
LINE3 |
100 |
0.03 |
0.04 |
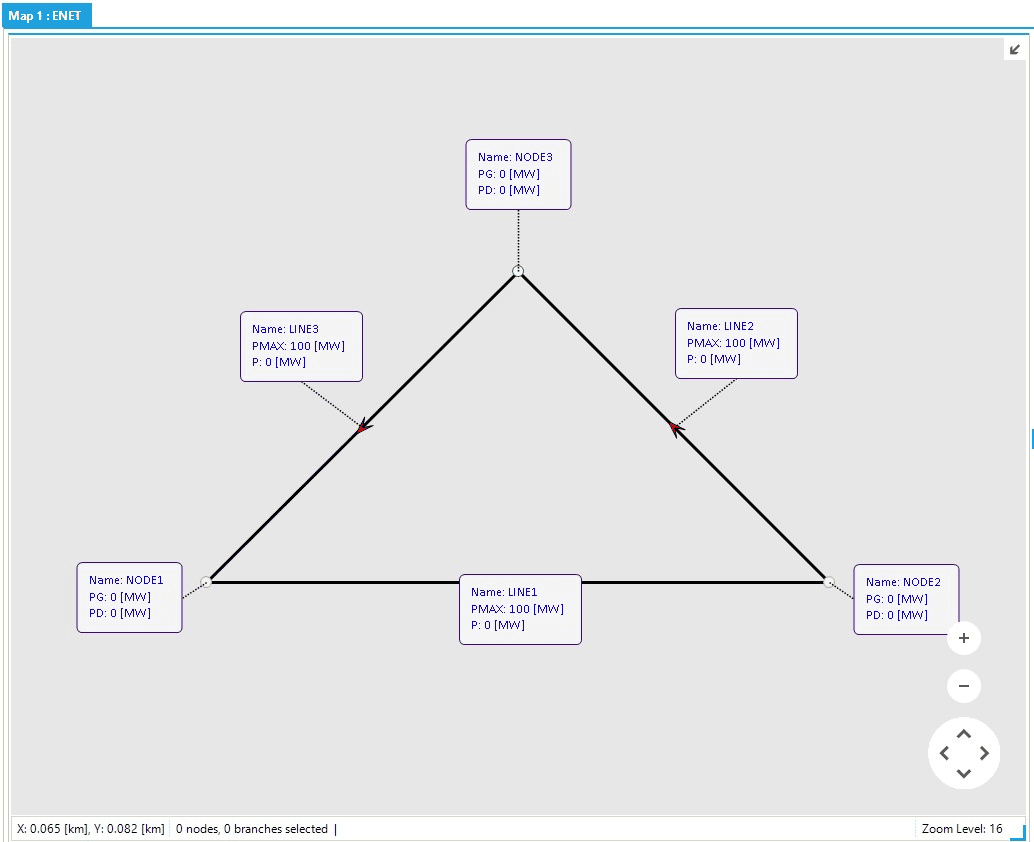
Add labels to the lines to display the object name (Name), maximum power capacity (PMAX), and active power flow (P) of the line.
The final system topology should look similar to Figure 6.