Expand the Network Topology
The next step in creating an AC power flow model is to expand the network to make a flag-shaped power system. This tutorial focuses on how to navigate the SAInt GUI to design a network. The objective is to learn how to create new branch and node objects, edit objects' properties, interact with the map window to change the network’s topology, and add object labels to display objects' details.
1. Navigate in the map window
The network topology and objects can be moved and manipulated in the map window. This window is located in the center of your screen (referred to in SAInt as the dock panel). Select the electrical line connecting the two nodes and then select a node from either side. Notice that the objects change color when selected and are marked magenta. Objects can be unmarked by pressing Esc. When an object is marked, the object properties are automatically displayed in the property editor window on the right-hand side of the screen.
|
Object properties shown in blue text can be edited. In contrast, properties in black text are read-only properties that the user cannot edit. Read-only properties are usually derived ones. |
2. Edit object properties
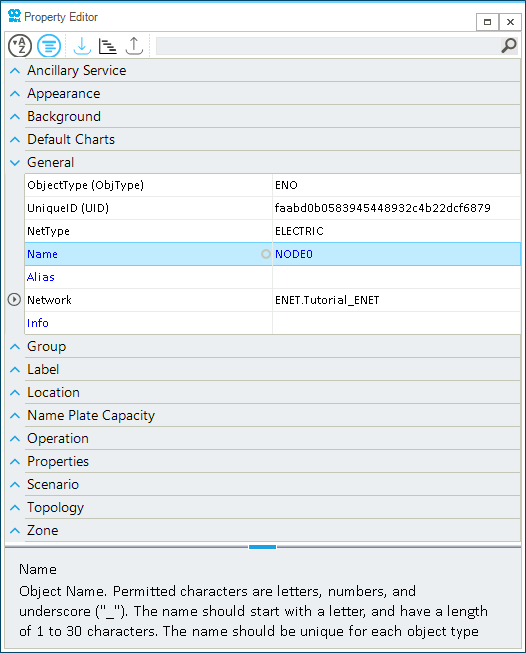
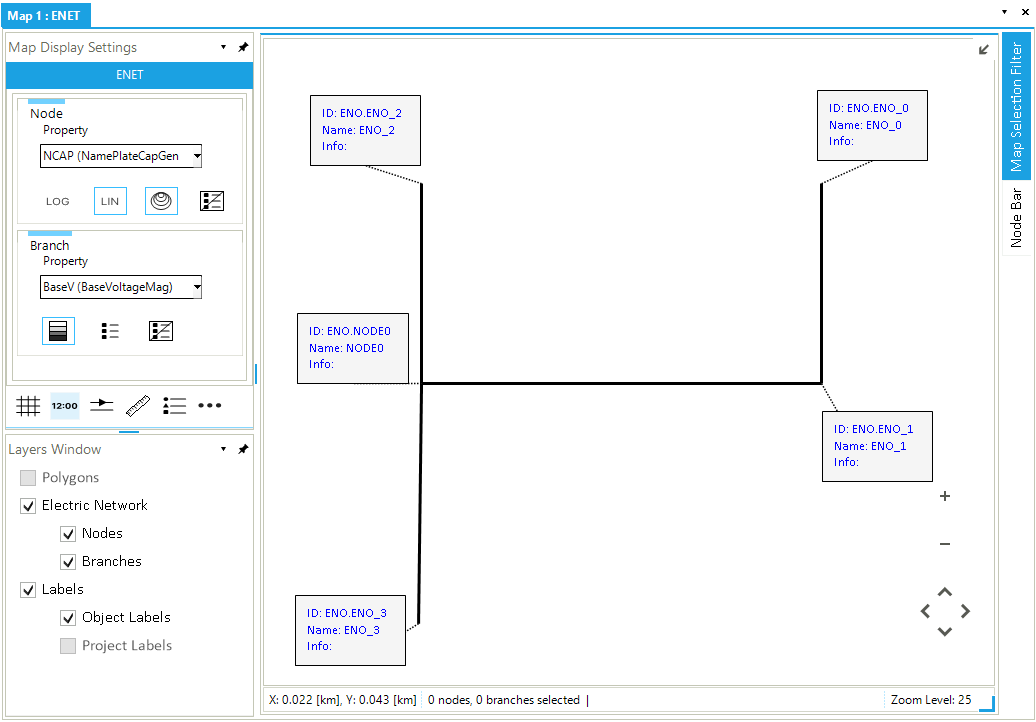
Select the node named ENO_0 located on the left side in the map window, and rename it in the property editor. Under the general category, find the Name property, and edit it to NODE0 (Figure 1). Use the same process to rename the node ENO_1 to NODE1.
|
Use the description box at the bottom of the property editor window to obtain more details about different properties. |
3. Add object labels
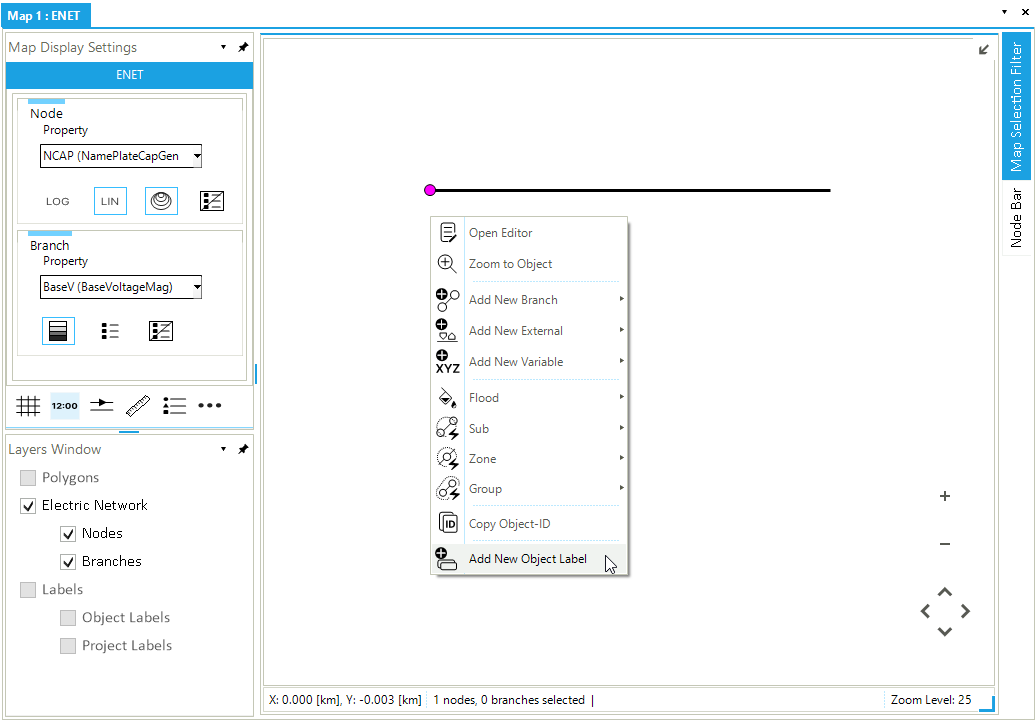
The label feature in SAInt allows users to visualize an object’s input and result properties directly in the map window. The simplest method to add a label is to right-click on top of an object in the map window and select the Add New Object Label option from the context menu (Figure 2). This will automatically create a default object label connected to the object with a dashed black line. Use this process to create default labels for both of the nodes. Default labels show the ID, Name, and Info properties. The labels can be repositioned by clicking and dragging the label box to the desired position.
4. Build the network with new objects
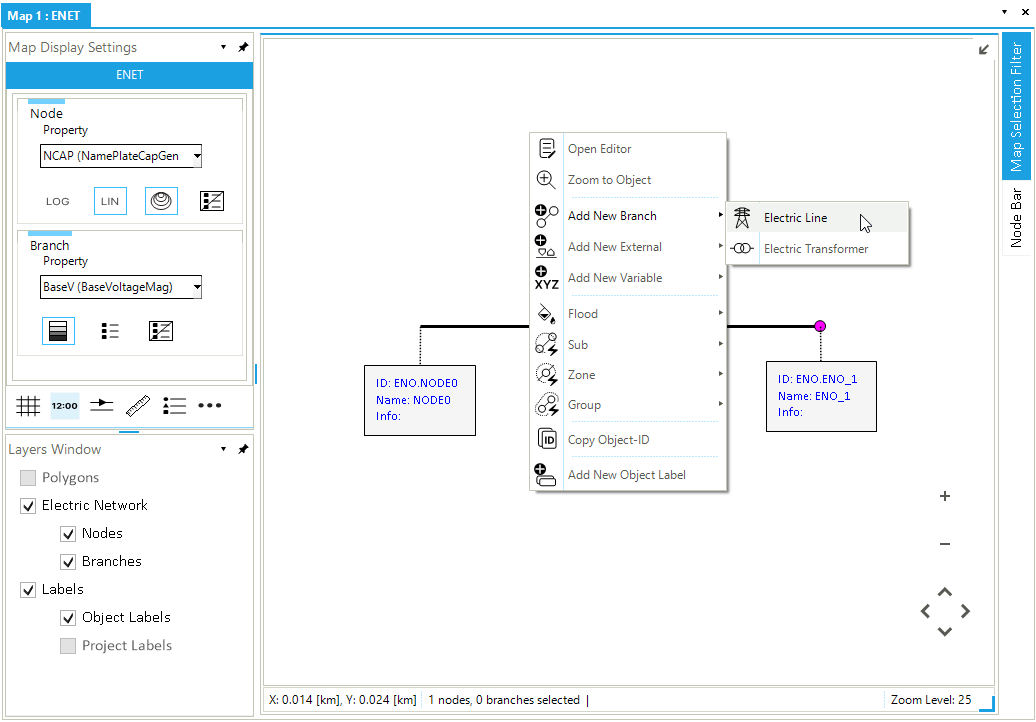
Expand the network by creating new nodes and branches. Mark NODE1 and right-click in a blank area of the map, and from the context menu, select (Figure 3). This will create a new line object connecting NODE1 to the new node located in the blank area you previously selected. Change the name of the newly created node to NODE2 and move the newly created node above NODE1.
Follow the same procedure to add two nodes directly above and below NODE0. Change the name of the node above to NODE3 and below to NODE4 (Figure 4). Once all the nodes are positioned correctly, add labels to NODE2, NODE3, and NODE4.
|
Nodes can be moved around in the map window by holding down Alt while selecting the node and dragging it around the map window. Alternatively, the node’s |
The final step to complete the network topology is to add another line connecting NODE2 and NODE3. Using the Shift key in the map window allows you to select multiple objects simultaneously. Mark NODE3 and hold Shift and select NODE2. Then right-click in the map window and select the .
5. Customize object labels
Now, we will edit the labels of all five nodes, mark the five labels (remember to hold Shift), right-click on top of one of the labels, and select the Multi Edit option. From here, we will edit the label information to display the following properties for the node:
-
Object name (
Name) -
Voltage magnitude per unit (
VPU) -
Voltage magnitude (
VM)
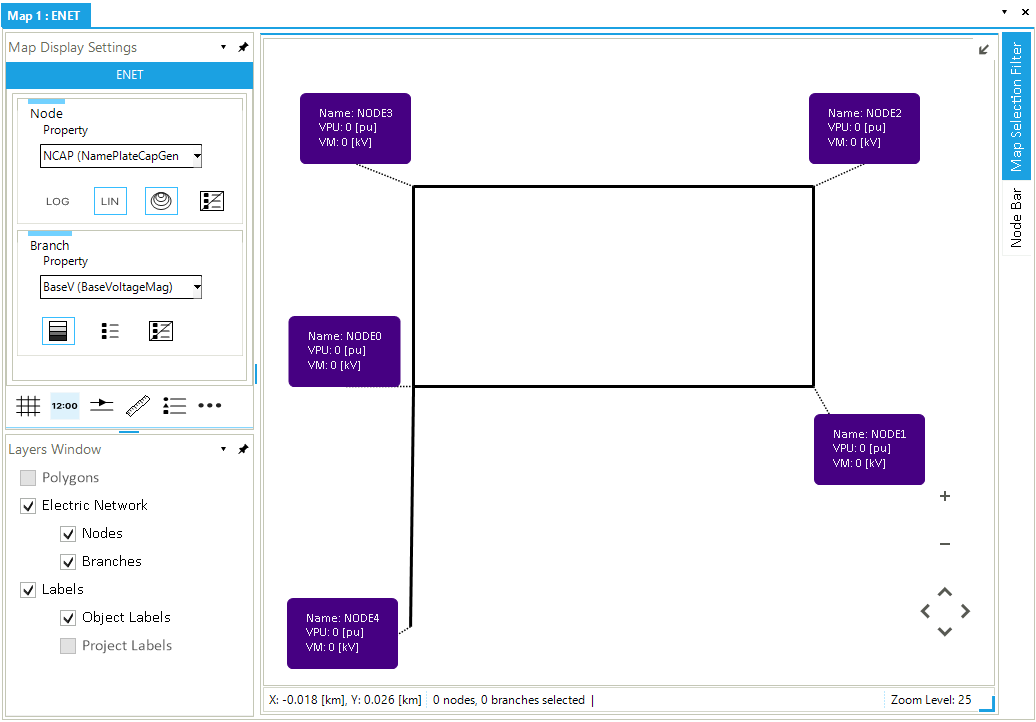
Change the LabelInfo property in the multi-edit window to Name: {@.Name},VPU: {@.VPU}, and VM: {@.VM}. The label’s look can be edited by changing the different properties under the background, font, frame, and visibility categories. Optionally, you can use Table 1 to edit the look of the node labels (Figure 5).
Click here for more details about custom node labels.
| Background | |
|---|---|
FillColor |
75,0,130 |
| Font | |
|---|---|
LabelFont |
Calibri, 9pt |
LabelFontColor |
245,245,245 |
| Frame | |
|---|---|
LabelFrameVisible |
TRUE |
RoundedLabelFrame |
TRUE |
StrokeWidth |
1 |
StrokeColor |
70,0,130 |
| Visibility | |
|---|---|
LabelVisible |
TRUE |
LabelStartZoomLevel |
13 |
LabelUntilZoomLevel |
17 |
LabelOpacity |
100 |
|
The values of |
6. Define object properties using tables
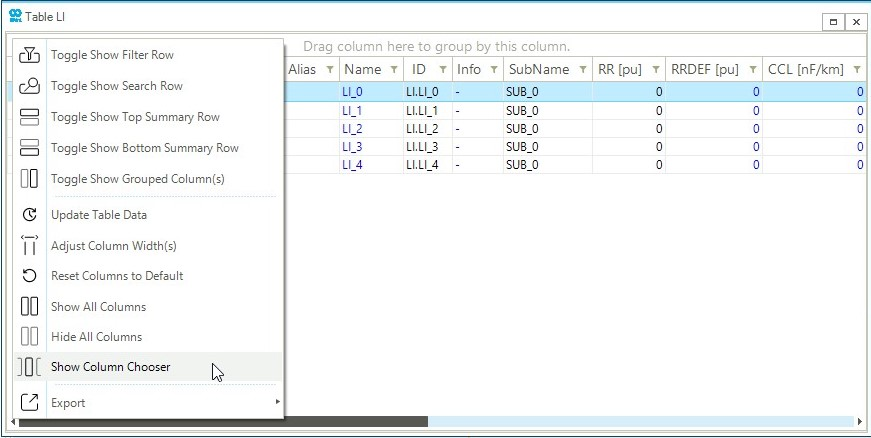
The object tables allow you to compare and edit properties of objects of the same type. To edit the properties of lines, go to the Table tab on the ribbon bar and select LI from the electric table container. The object table will appear with default properties. To add additional properties, right-click in the top-left corner of the table window and choose Show Column Chooser (Figure 6). This will open a window where you can add or remove columns. Search for maximum current (IMAXDEF [A]), and maximum apparent power (SMAXDEF [MVA]), length (L [km]), and drag the properties to the table. To remove a column, drag it from the table to the column chooser window. Feel free to customize the table to your preference.
Once the table’s columns has been customized, you can directly set the properties of the lines presented in Table 2 and Table 3. Remember you can only edit properties which are colored in blue.
| Name | Name of FromNode | Name of ToNode | Length | Line Impedance |
|---|---|---|---|---|
|
|
|
|
|
LINE0 |
NODE0 |
NODE1 |
100 |
TRUE |
LINE1 |
NODE1 |
NODE2 |
50 |
TRUE |
LINE2 |
NODE3 |
NODE2 |
100 |
TRUE |
LINE3 |
NODE0 |
NODE3 |
50 |
TRUE |
LINE4 |
NODE0 |
NODE4 |
50 |
TRUE |
| Name | Default maximum current | Default maximum apparent power | Resistance per length | Reactance per length |
|---|---|---|---|---|
|
|
|
|
|
LINE0 |
1150 |
250 |
0.042 |
0.275 |
LINE1 |
1150 |
250 |
0.042 |
0.275 |
LINE2 |
1150 |
250 |
0.042 |
0.275 |
LINE3 |
1150 |
250 |
0.042 |
0.275 |
LINE4 |
1150 |
250 |
0.042 |
0.275 |
Following, go to the Table tab on the ribbon bar and select ENO from the electric table container, and edit the properties of the nodes using the data provided in Table 4. Leave the default value for all other properties not mentioned in the table.
| Object Name | Coordinates | Nominal Voltage Magnitude | Default maximum voltage magnitude | Default minimum voltage magnitude |
|---|---|---|---|---|
|
|
|
|
|
NODE0 |
0/0 |
230 |
1.05 |
0.95 |
NODE1 |
100/0 |
230 |
1.05 |
0.95 |
NODE2 |
100/50 |
230 |
1.05 |
0.95 |
NODE3 |
0/50 |
230 |
1.05 |
0.95 |
NODE4 |
0/-50 |
230 |
1.05 |
0.95 |
Finally, add labels to the lines by selecting all the lines (remember to hold Shift), right-click on top of one of the lines, and select the Add New Object Label option. Edit the label information to display the following properties for the lines:
-
Object name (
Name) -
Current magnitude to node (
IT) -
Active power loss (
PL) -
Reactive power loss (
QL) -
Line loading current (
LLI) -
Line loading apparent power (
LLS)
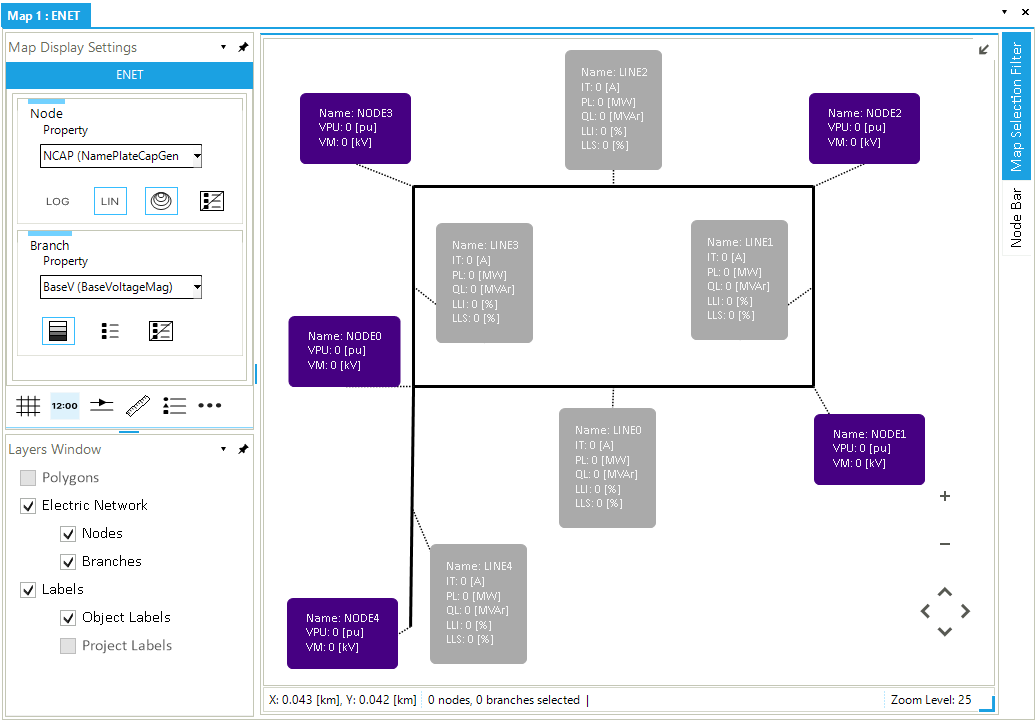
In the multi-edit window, change the LabelInfo property to Name: {@.Name}, IT: {@.IT}, PL: {@.PL}, QL: {@.QL}, LLI: {@.LLI}, LLS: {@.LLS}. The final system topology should look similar to Figure 7. Optionally, use Table 5 to customize the look of the line labels.
Click here for more details about custom line labels.
| Background | |
|---|---|
FillColor |
170,170,170 |
| Font | |
|---|---|
LabelFont |
Calibri, 9pt |
LabelFontColor |
245,245,245 |
| Frame | |
|---|---|
LabelFrameVisible |
TRUE |
RoundedLabelFrame |
TRUE |
StrokeWidth |
1 |
FrameColor |
170,170,170 |
| Visibility | |
|---|---|
LabelVisible |
TRUE |
LabelStartZoomLevel |
13 |
LabelUntilZoomLevel |
17 |
LabelOpacity |
100 |
|
Edit the object label’s colors, size, and font to quickly identify different objects in your network. |