Step 2: Expand the Network Topology
The next step in creating a hydraulic model is to expand the network topology to describe the gas system of interest. This tutorial will focus on how to navigate the SAInt GUI to design a network. The objective is to learn how to create new branch and node objects, edit objects' properties, interact with the map window to change the network’s topology, and add labels to display objects' details.
1. Navigate in the map window
The map window is the right place to change the objects' location and to edit the network’s topology. This window is located in the center of SAINnt’s main window. This area of SAInt is called the Dock Panel. Select the pipeline connecting the two nodes by clicking on it. After, select a node from either side. Notice that the selected object changes color when selected. It is now magenta. You deselect objects by pressing Esc. When an object is selected, its properties are automatically displayed in the property editor window on the right-hand side of the screen.
|
Object properties shown with blue text can be edited. In contrast, properties in black text are read-only properties that the user cannot edit. Read-only properties are usually derived ones. |
2. Edit object properties
Select the node located on the left side of the pipeline and check its name in the property editor by looking for the property Name in the section "General.". Rename the node by changing the default name GNO_0 to NODE1, as seen below in Figure 1. Use the same process to rename the other node from GNO_1 to NODE2.
After that, change the property "X-Coordinate" X of the node GNO.NODE2 from zero to 30 kilometers and the "Y-Coordinate" Y to 0.
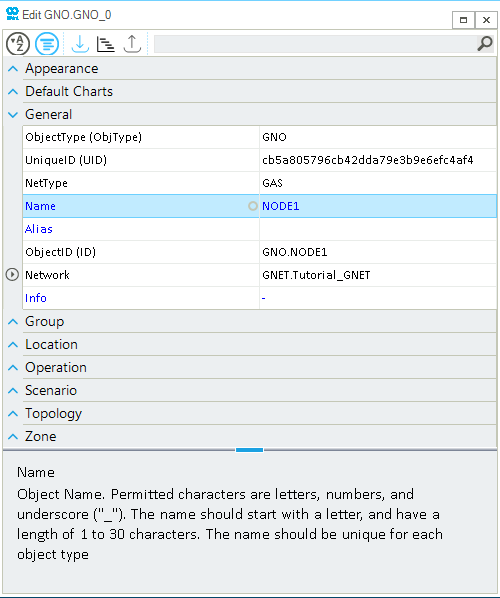
Name. Please, note that some properties in the picture can be different from the ones in your session.|
Use the description box at the bottom of the property editor window to obtain more details about the property you have selected. |
3. Add object labels
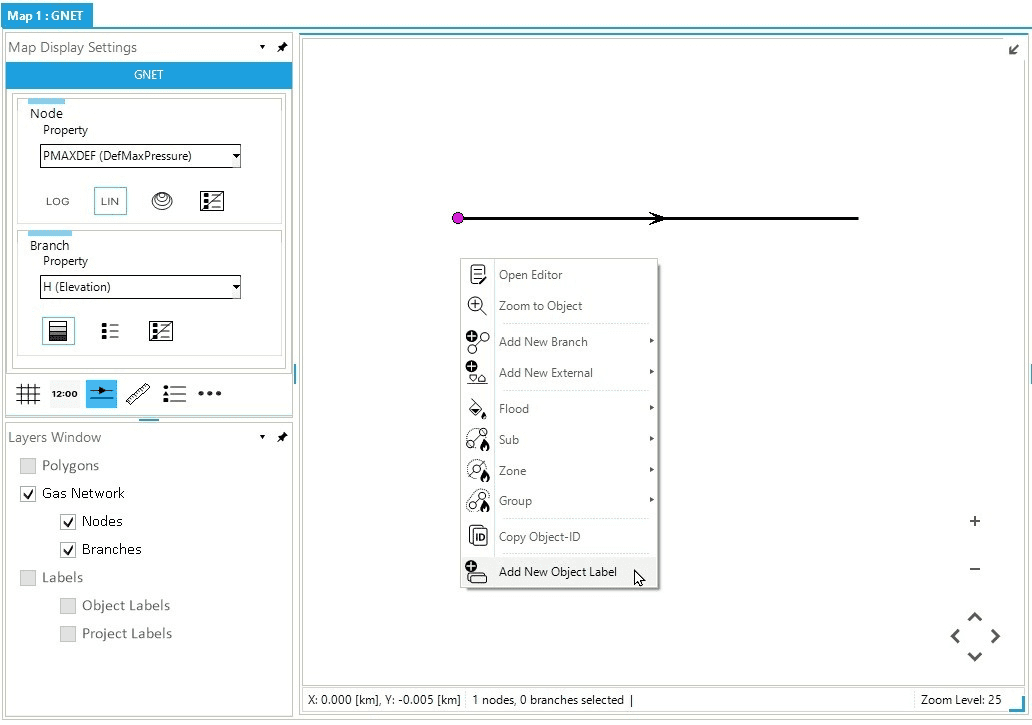
The label feature in SAInt allows users to visualize information and properties of an object directly in the map window. The simplest method to add a label is to right-click when hoovering on a selected object in the map window and select Add New Object Label from the context menu, as shown in Figure 2. This method automatically creates a default object label connected to the object with a dotted black line. Default labels show the ID, Name, and Info properties. The labels can be repositioned by clicking and dragging the label box to the desired position. You can always change the properties of a label from the property editor. Add the default label to GNO.NODE1.
|
Note the difference in the color between an active object when you hover over it and a selected object when you right-click on it (i.e., color magenta). |
4. Add new objects to the network
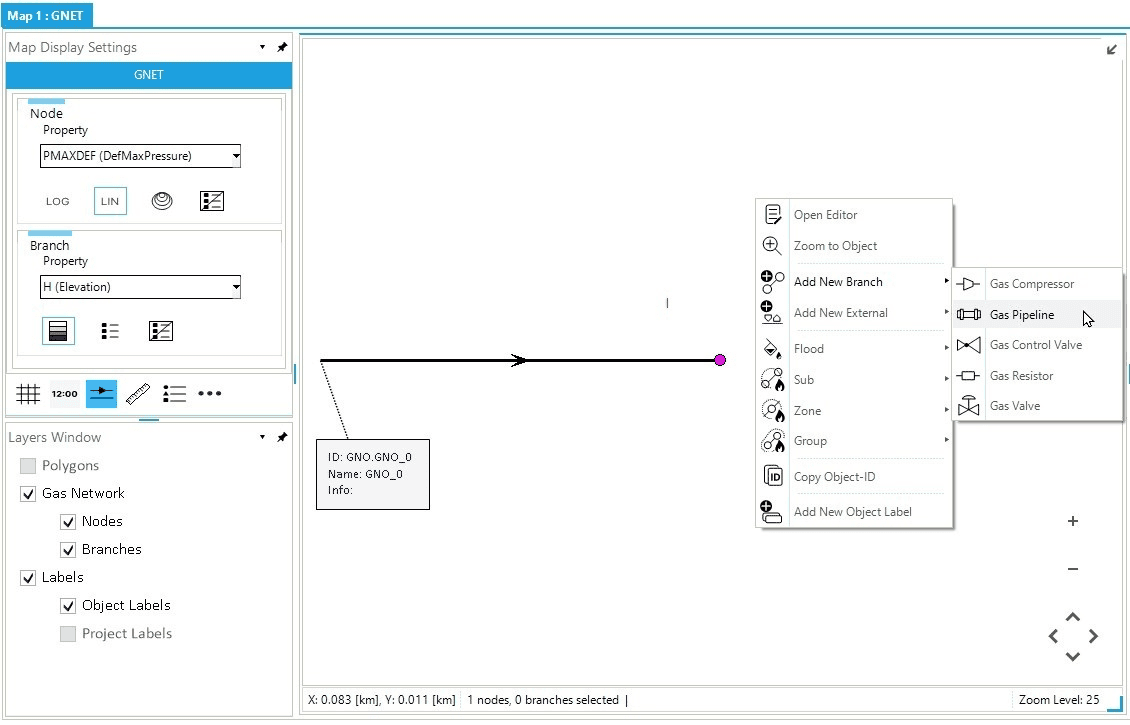
Expand the network by creating a new branch object of the class "pipeline." Select node GNO.NODE2, move the cursor away to the top and right-click in a blank map area. From the context menu, select , as shown in Figure 3. This procedure creates a new line object connecting GNO.NODE2 to a newly created node at the cursor’s position. Change the node’s name to NODE3 and move the node to coordinates X equal to 30 km and Y equal to 20 km. Once positioned correctly, add a label to GNO.NODE3.
|
Objects can be dragged around the map window by holding down Alt while selecting the node. However, with this method, you cannot control the exact location. You can change the |
Finish your network by adding a control valve and a third pipeline. Start by selecting node GNO.NODE2, move the cursor away to the right and right-click in a blank map area. From the context menu, select . Change the Name of the control valve to CV and the Name of the newly added node (by default, it is GNO_0) to NODE4. Change the X-coordinate of GNO.NODE4 to X equal to 30.1 km and Y-coordinate to 0. Please note that the length of this object does not affect the simulation. Finally, add the default label to the control valve.
Now, select node GNO.NODE4, move the cursor away to the right and right-click in a blank map area. From the context menu, select . Change the Name of the newly added node to NODE5. Edit its coordinates by setting X to 60.1 km and Y to 0 km, and add the default label.
5. Customize objects' labels
Now, edit the four labels you have created. Please select all the labels associated with nodes (remember to hold Shift), right-click on top of one of them, and from the context menu, choose the Multi Edit option. A new property editor window opens; from here, you can edit all selected labels simultaneously. Change the LabelInfo property to Name;P;Q; in the multi edit window. In this way, a label displays the object name (Name), the nodal pressure (P), and the nodal in- or out-flow (Q).
After, you can change the LabelInfo property for the control valve label by setting the value to Name;PI;PO;Q;. This setting value displays the object name (Name), the nodal pressure at the inlet point (PI) and the outlet point (PO), and the flow through the valve (Q).
The label’s look can also be modified by changing the different properties under the background, font, frame, and visibility categories. Optionally, you can use Table 1 to edit the node labels as in Figure 4.
Click here for more details about custom node labels.
| Background | Nodes | Control Valve |
|---|---|---|
LabelTopBackColor |
0,4,197 |
85,85,85 |
LabelBottomBackColor |
0,4,197 |
85,85,85 |
| Font | Nodes | Control Valve |
|---|---|---|
LabelFont |
Calibri, 12pt |
Calibri, 12pt |
LabelFontColor |
255,255,255 |
255,255,255 |
| Frame | Nodes | Control Valve |
|---|---|---|
LabelFrameVisible |
TRUE |
TRUE |
RoundedLabelFrame |
TRUE |
TRUE |
FrameColor |
10,138,255 |
0,0,0 |
| Visibility | Nodes | Control Valve |
|---|---|---|
LabelVisible |
TRUE |
TRUE |
LabelStartZoomLevel |
25 |
25 |
LabelUntilZoomLevel |
5000 |
5000 |
Label Opacity |
100 |
100 |
6. Define object properties using tables
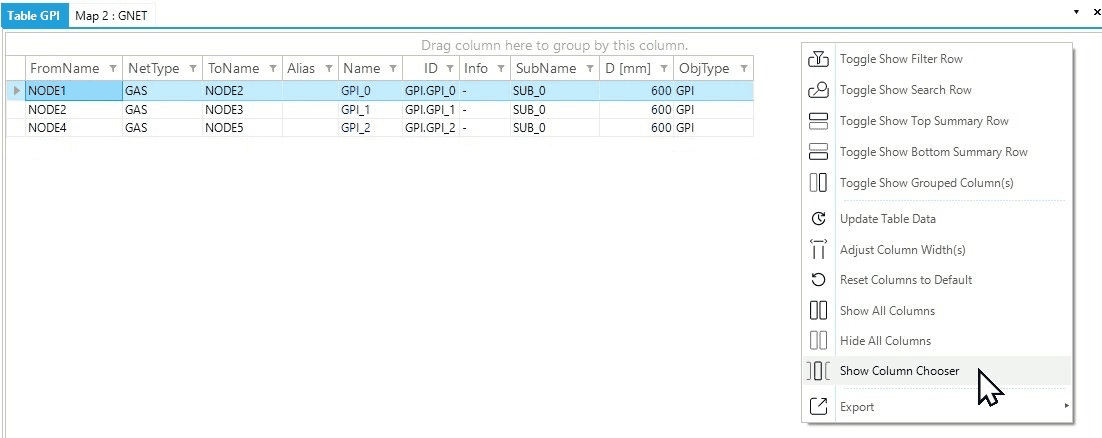
The objects table can be used to compare and edit the properties of objects belonging to the same object type. You will use the pipeline object table to edit the properties of the pipelines. Access the objects table by going to the ribbon bar on top of the screen and select GPI from the gas table gallery. The object table will open with a set of default properties displayed. Right-click anywhere in the empty space around the table and select the Show Column Chooser option, as shown in Figure 5. The column chooser window will open. With this, you can freely add and remove columns from the table. Search for the wall thickness (WTH) and the pipeline length (L) and drag and drop the item between the columns to add it to the table. The opposite process can be used to remove a column from the table. Select the column header and drag and drop it in the column chooser window to remove it. Feel free to spend some time editing the table to your liking.
Once the table’s columns have been customized, you can directly edit the data of the pipelines presented in Table 2. Change the values for the pipeline name (e.g., GPI_0 to PIPE1), wall thickness, pipeline inner diameter, and pipeline length. Remember you can only edit text which is written in blue.
| Name | Inner pipe diameter | Thickness of the pipe wall | Pipeline length |
|---|---|---|---|
|
|
|
|
PIPE1 |
584.2 |
12.7 |
30 |
PIPE2 |
381 |
12.7 |
20 |
PIPE3 |
381 |
12.7 |
30 |
You can follow the same approach for editing the properties of the control valve. Alternatively, select the control valve and use the property editor to change the inner valve diameter (D) to 584.2 mm and leave all other properties to their default value.
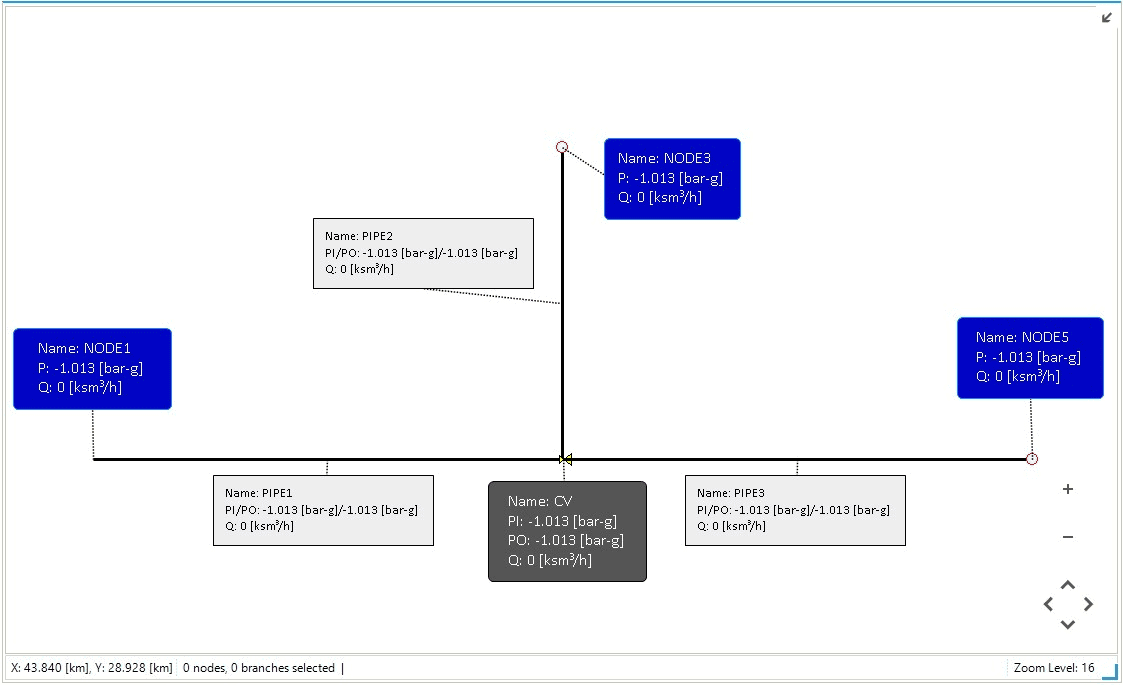
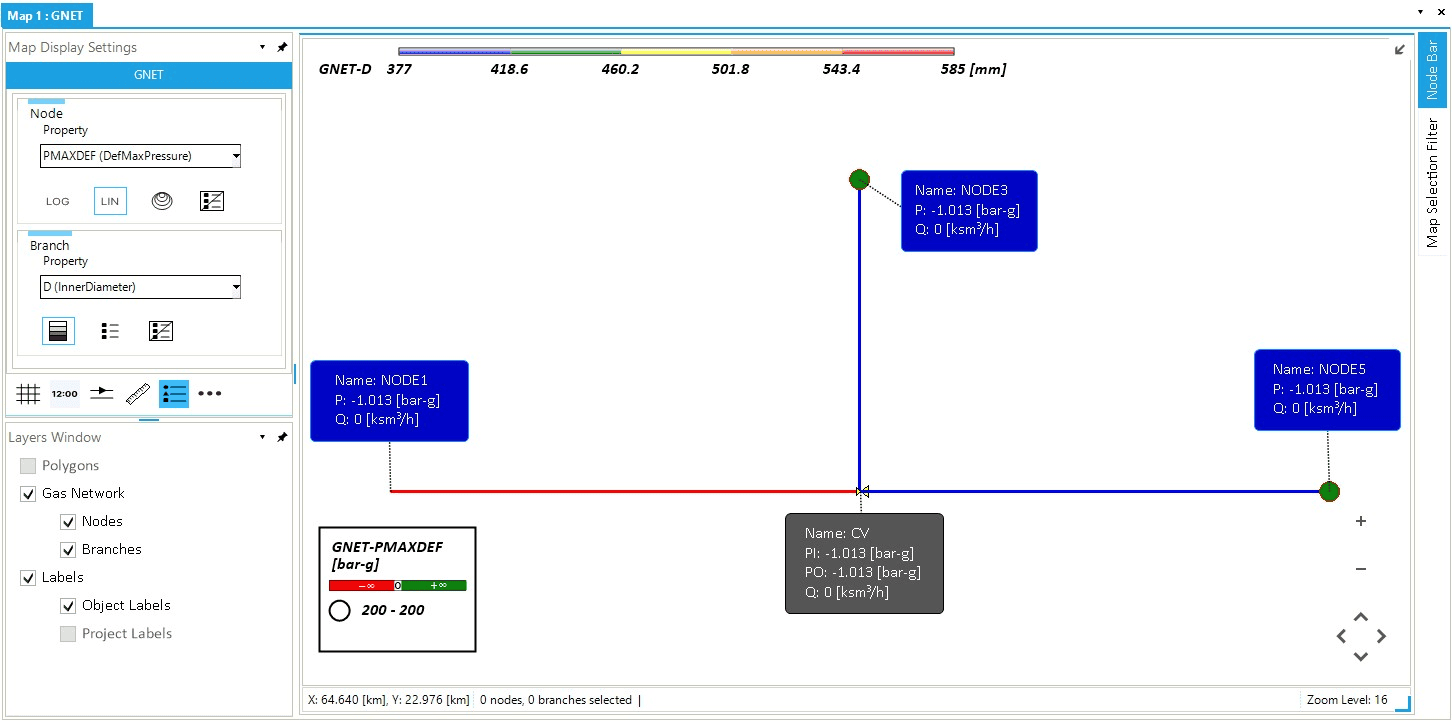
If you want, you could add labels to the pipelines to display the object name (Name), the average pressure in the pipeline (P), and the flow (Q). The final system topology should look similar to Figure 6. Use Table 3 to customize the look of the line labels.
Click here for more details about custom line labels.
| Background | |
|---|---|
LabelTopBackColor |
255,255,255 |
LabelBottomBackColor |
255,255,255 |
| Font | |
|---|---|
LabelFont |
Calibri, 8pt |
LabelFontColor |
0,0,0 |
| Frame | |
|---|---|
LabelFrameVisible |
TRUE |
RoundedLabelFrame |
TRUE |
FrameColor |
0,0,0 |
| Visibility | |
|---|---|
LabelVisible |
TRUE |
LabelStartZoomLevel |
25 |
LabelUntilZoomLevel |
5000 |
Label Opacity |
100 |
|
Edit the object label’s colors, size, and font to quickly identify different objects or highlight import objects in your network. |
|
Enlarge the frame of a label to accommodate its text better. Select the label, hover on the frame that turns pink, and drag the border next to the white square markers. |