Step 2: Expand the Network Topology
The next step in creating a thermal model involves expanding the network topology to represent the thermal system of interest. This tutorial will focus on navigating the SAInt GUI to design a network. The objective is to learn how to create new branch and node objects, edit objects' properties, interact with the map window to change the network’s topology, and add labels to display objects' details.
1. Navigate in the map window
The map window allows to modify the objects' location and to edit the network’s topology. This window can be found at the center of SAInt’s main interface, referred to as the Dock Panel. Select the pipeline connecting the two nodes and choose a node from either side. Notice that a selected object changes its color to magenta upon selection. Objects can be deselected by pressing the Esc key. When an object is marked, its properties are automatically displayed in the property editor window on the right-hand side of the screen.
|
Object properties shown with blue text can be edited. In contrast, properties in black text are read-only properties that the user cannot edit. Read-only properties are usually derived ones. |
2. Edit object properties
Select the node located on the left side of the pipeline, named TNO_0. verify its name in the property editor by searching for the property labeled Name within the "General" section. Rename the node by changing the default name TNO_0 to NODE1, as seen below in Figure 1. Use the same process to rename the other node from TNO_1 to NODE2. Now change the name of the pipeline into PIPE1.
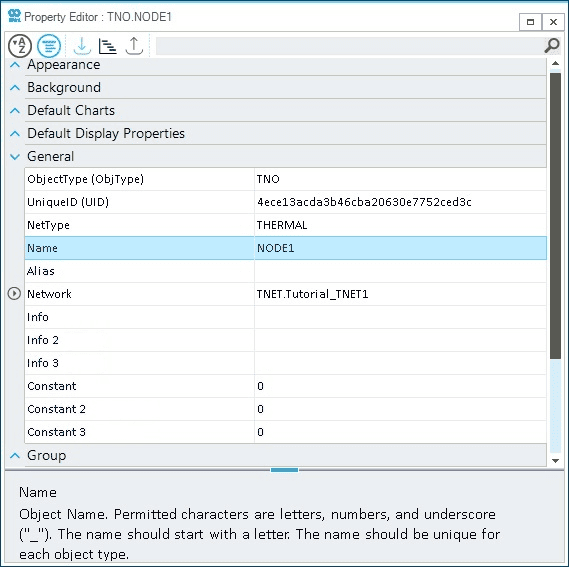
Name. Please, note that some properties in the picture can be different from the ones in your session.|
Use the description box at the bottom of the property editor window to obtain more details about the property you have selected. |
3. Add object labels
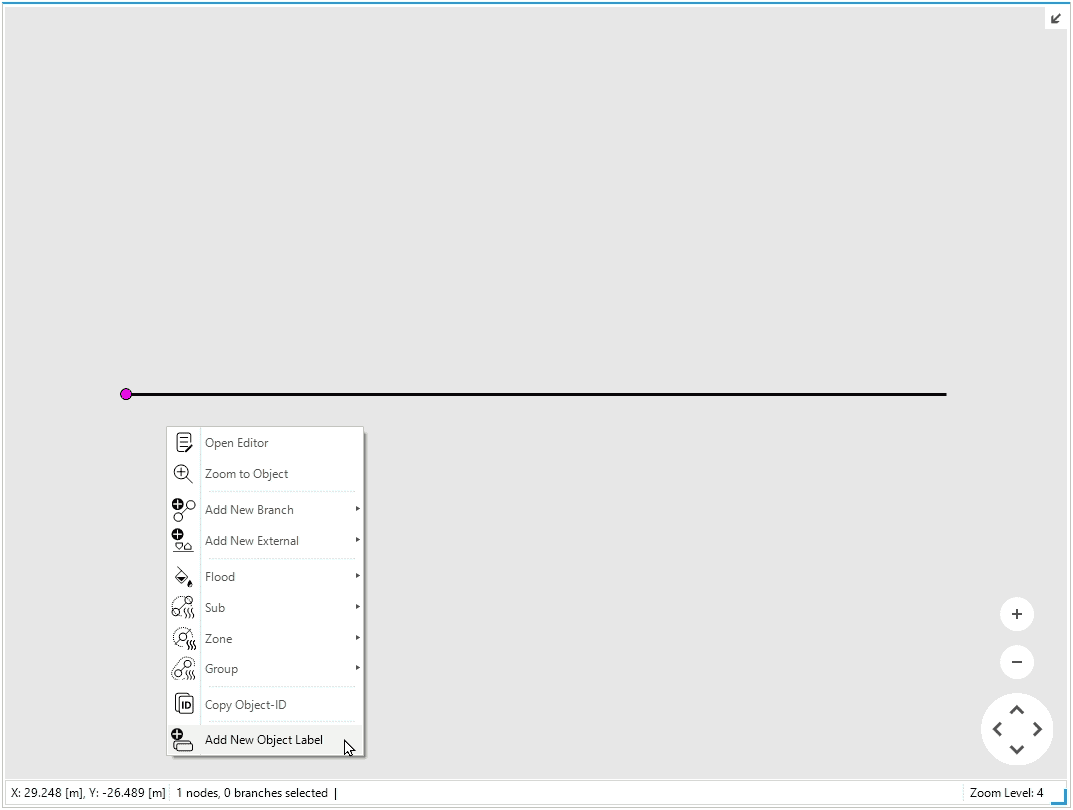
The label feature in SAInt allows users to visualize information and properties of an object directly in the map window. The simplest method to add a label is to right-click when hovering on a selected object in the map window and select Add New Object Label from the context menu, as shown in Figure 2. This method automatically creates a default object label connected to the object with a dotted black line. Default labels show the ID, Name, and Info properties. The labels can be repositioned by clicking and dragging the label’s frame to the desired position. You can always change the properties of a label from the property editor. Add the default label to TNO.NODE1.
|
Note the difference in the color between an active object when you hover over it and a selected object when you right-click on it (i.e., color magenta). |
4. Add new objects to the network
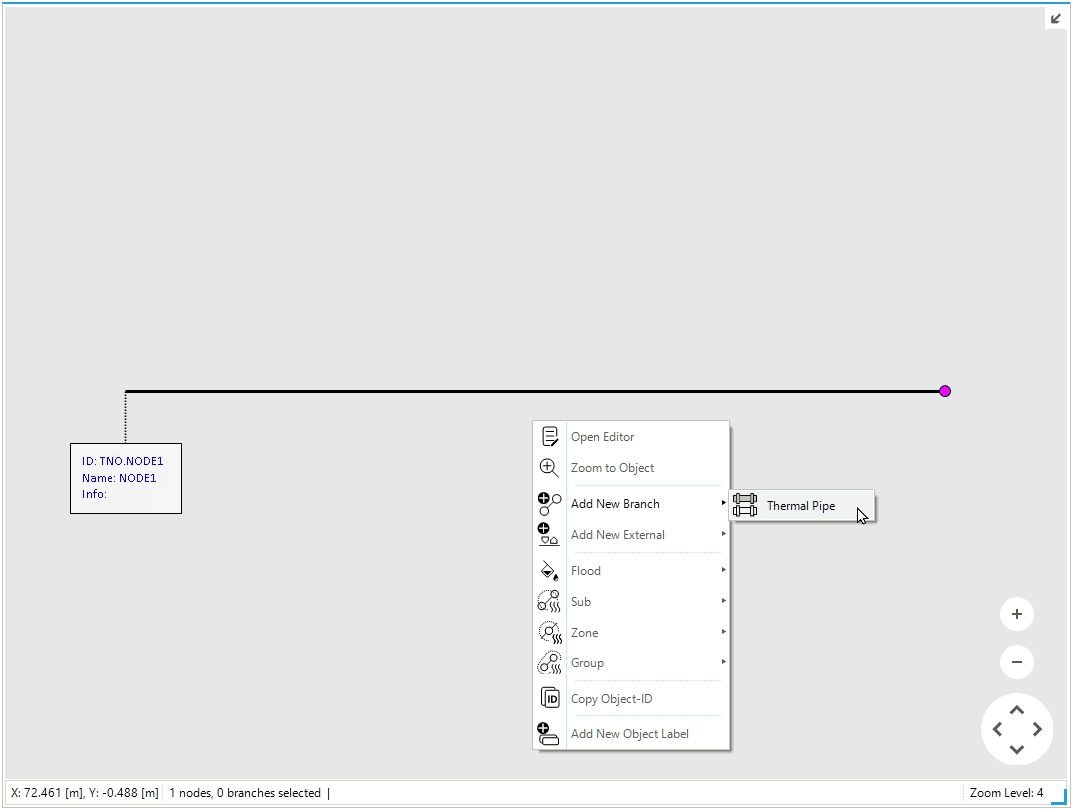
Expand the network by creating a new branch object of the class "Thermal pipeline". Select node TNO.NODE2, move the cursor away to the top and right-click on a blank map area. From the context menu, select , as shown in Figure 3. This procedure creates a new line object connecting GNO.NODE2 to a newly created node at the cursor’s position. Change the node’s name to NODE3 and move the node to coordinates X equal to 100 m and Y equal to 45 m under Location in the property editor. Once positioned correctly, add a label to TNO.NODE3. Modify the pipeline’s name to PIPE2.
|
Objects can be dragged around the map window by holding down Alt while selecting the node. However, this method does not provide precise control over the object’s location. for precise positioning, adjust the |
Complete this section of your network by adding three other pipelines connecting the NODE2 to the new node NODE4 (PIPE3), NODE5 (PIPE4), and NODE6 (PIPE5) and use the map window and the data available in Table 1 to modify their positions. Modify the direction of the pipeline TPI_2 connecting the NODE2 and NODE6 by right-clicking on that pipe and then select . Add two pipelines at the NODE1.
Now, create a new section of the network by adding two new pipelines connecting NODE1 to NODE7 (PIPE6) and to NODE8 (PIPE7). Finally add two other branches connecting NODE8 with NODE9 (PIPE8) and NODE10 (PIPE9).
Use the data provided in Table 1 to define name and location of the nodes and the name of the pipelines.
| Pipeline Name | From Node | X [m] |
Y [m] |
H [m] |
To Node | X [m] |
Y [m] |
H [m] |
|---|---|---|---|---|---|---|---|---|
PIPE1 |
Node1 |
0 |
0 |
40 |
Node2 |
100 |
0 |
40 |
PIPE2 |
Node2 |
100 |
0 |
40 |
Node3 |
100 |
45 |
55 |
PIPE3 |
Node2 |
100 |
0 |
40 |
Node4 |
145 |
45 |
65 |
PIPE4 |
Node2 |
100 |
0 |
40 |
Node5 |
150 |
0 |
40 |
PIPE5 |
Node2 |
100 |
0 |
40 |
Node6 |
100 |
-60 |
65 |
PIPE6 |
Node1 |
0 |
0 |
40 |
Node7 |
0 |
50 |
70 |
PIPE7 |
Node1 |
0 |
0 |
40 |
Node8 |
0 |
-45 |
50 |
PIPE8 |
Node8 |
0 |
-45 |
50 |
Node9 |
-50 |
-45 |
50 |
PIPE9 |
Node8 |
0 |
45 |
25 |
Node10 |
50 |
-45 |
50 |
5. Customize object labels
Let’s add a default label to each node. Select all the labels associated with nodes (remember to hold Shift), then right-click on top of one of them and select the Multi Edit option from the context menu (the multi edit can also be accessed directly on the right side of the map window once labels have been selected). A new property editor window opens, from which the selected labels can be edited simultaneously. Modify the LabelInfo property to Name: {this.Name}, H: {this.H}, and Mass Flow: {this.Q} in the multi edit window. Each entry is on a new line. In this way, a label will display the object name (Name), the elevation (H), and the nodal mass flow rate (Q).
The appearance of the label can also be modified by changing the different properties under the background, font, frame, and visibility categories. Optionally, you can use Table 2 to edit the node labels, as in Figure 4.
Let’s also practice how to remove a label. Select the one at NODE1, and right-click. From the context menu, select Delete Label(s). There is also the possibility of cutting and pasting a label from the same context menu, but this works only when manipulating labels for the same type of object. Finally, remove the label linked to NODE2 and NODE8. In this way, we can focus only on nodes with external associated with.
| Background | Nodes |
|---|---|
FillColor |
238,238,238 |
| Font | Nodes |
|---|---|
LabelFont |
Calibri, 9pt |
LabelFontColor |
0,0,0 |
| Frame | Nodes |
|---|---|
LabelFrameVisible |
TRUE |
RoundedLabelFrame |
TRUE |
StrokeColor |
0,0,0 |
| Visibility | Nodes |
|---|---|
LabelVisible |
TRUE |
LabelStartZoomLevel |
1 |
LabelUntilZoomLevel |
23 |
Label Opacity |
65 |
6. Define object properties using tables
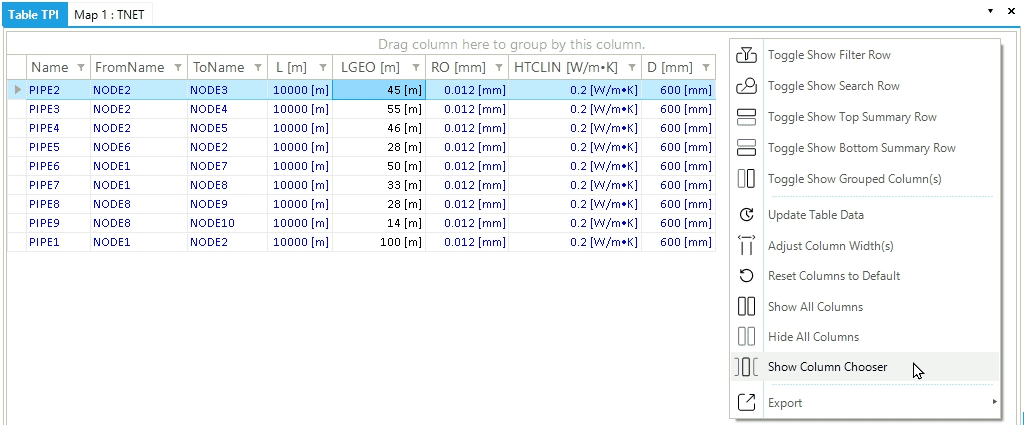
The objects table can be used to compare and edit the properties of objects belonging to the same object type. You will use the pipeline object table to edit the properties of the pipelines. Access the objects table by going to the ribbon bar on top of the screen and select TPI from the thermal table gallery. The object table will open with a set of default properties displayed. Right-click anywhere in the empty space around the table and select the Show Column Chooser option, as shown in Figure 5. The column chooser window will open. With this, you can freely add and remove columns from the table. Search for the inner pipe roughness (RO) and the pipeline length (L) and drag and drop the item between the columns to add it to the table. The opposite process can be used to remove a column from the table. Select the column header and drag and drop it in the column chooser window to remove it. Feel free to spend some time editing the table to your liking.
Once the table’s columns have been customized, you can directly edit the data of the pipelines presented in Table 3. Change the values for the wall thickness, pipeline inner diameter, and pipeline length. Remember you can only edit text which is written in blue. Compare the value of the length against the property LGEO (i.e., the length based on the coordinates). In some cases the value for the calculations defined for the property L and the value derived by using the coordinates of the nodes are different. Length is measured in meters.
| Name | Inner pipe diameter | Pipeline roughness | Linear heat transfer coefficient | Pipeline length |
|---|---|---|---|---|
|
|
|
WTH [mm]` |
|
PIPE1 |
300 |
0.012 |
0.09 |
100 |
PIPE2 |
150 |
0.02 |
0.15 |
45 |
PIPE3 |
150 |
0.02 |
0.15 |
55 |
PIPE4 |
150 |
0.02 |
0.15 |
46 |
PIPE5 |
150 |
0.02 |
0.15 |
28 |
PIPE6 |
300 |
0.012 |
0.09 |
50 |
PIPE7 |
100 |
0.03 |
0.4 |
33 |
PIPE8 |
100 |
0.03 |
0.4 |
28 |
PIPE9 |
100 |
0.03 |
0.4 |
14 |
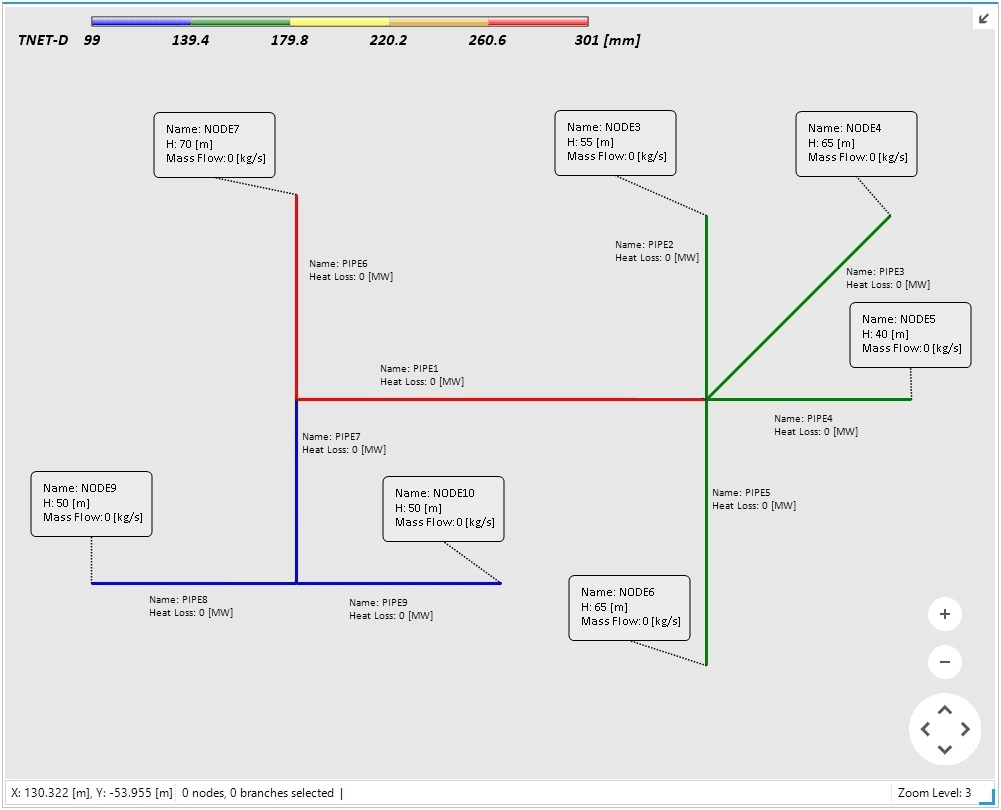
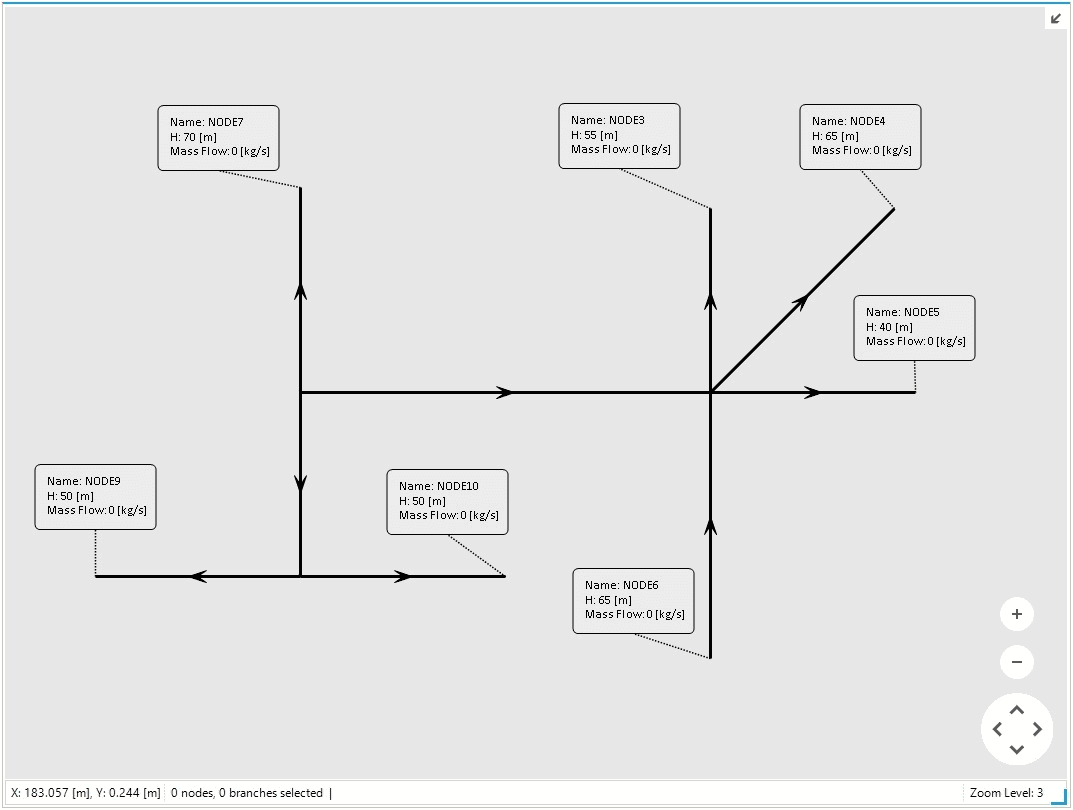
Add labels to the pipelines to display the object name (Name) and the heat loss on the hot side (LOSS). The final system topology should look similar to Figure 6. Use Table 4 to customize the look of the line labels.
And before moving to the next step, remember to save your work.
| Background | Pipelines |
|---|---|
FillColor |
238,238,238 |
| Font | Pipelines |
|---|---|
LabelFont |
Calibri, 8pt |
LabelFontColor |
0,0,0 |
| Frame | Pipelines |
|---|---|
LabelFrameVisible |
FALSE |
RoundedLabelFrame |
FALSE |
FrameColor |
0,0,0 |
| Reference | Pipelines |
|---|---|
LabelOriginLine |
FALSE |
| Visibility | Pipelines |
|---|---|
LabelVisible |
TRUE |
LabelStartZoomLevel |
1 |
LabelUntilZoomLevel |
23 |
Label Opacity |
0 |
|
Edit the object label’s colors, size, and font to quickly identify different objects or highlight import objects in your network. |