Define QuasiDynamicACPF Scenario Profiles
Dynamic or time-dependent variables in SAInt are modeled using a scenario profile. Each profile is composed of equidistant data points that describe the change of an object’s property over time. This step will focus on developing profiles to define the hourly scheduled demand and generation profiles in the SAInt GUI. The objective is to understand how different properties affect a profile and learn how to visualize, create and edit profile data points.
1. Open the profile table
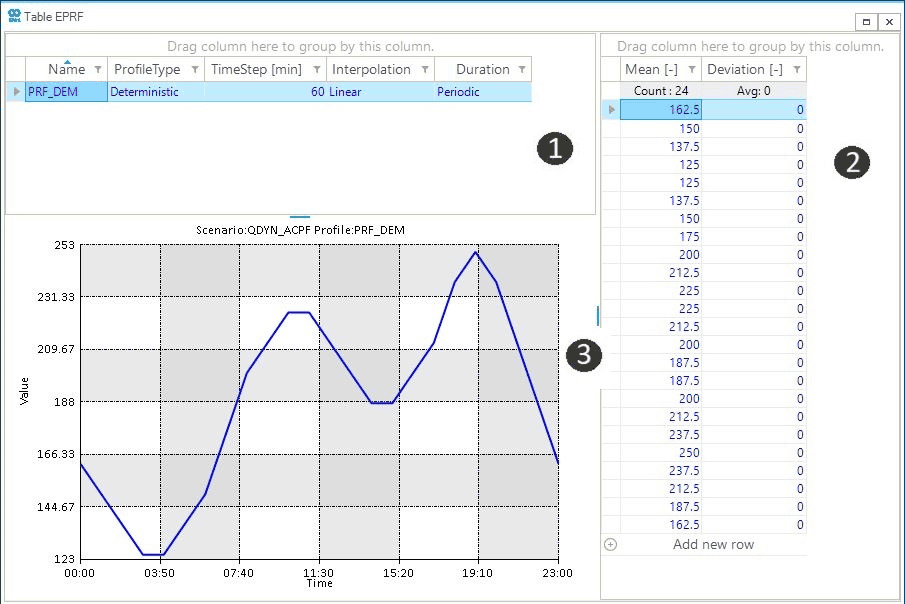
For this QuasiDynamicACPF simulation, one demand, two generic generator, and one wind generator objects will be modeled with time series data which will be implemented as profiles. Open the profile table by going to the scenario tab and select EPRF. The profile table is separated into three main sections (Figure 1).
-
Profile description table (❶): this section allows the user to see and edit the properties of the profiles; this includes properties such as the profile name, type, and time step. Additionally, you can directly create and delete profiles for the scenario file.
-
Profile data table (❷): this section displays the time series data points of the currently selected profile (highlighted in orange in section 1). Here you can directly edit the profile time series by changing, adding, or removing any cell of the profile data series. The data
Meancolumn must be filled to define the profile’s data points, while theDeviationcolumn is only used for stochastic profiles. -
Profile chart window (❸): this section plots the values of the profile data points against the scenario time window to visualize the dynamic behavior of the currently selected profile.
2. Create a profile
We will now create the profile shown in Figure 1. Go to the profile description table, right-click and select Create Profile. A new profile will appear, and we can now edit the profile properties. For the first profile, we will use the default properties but edit the profile’s name to PRF_DEM, by entering the name under the Name column.
3. Enter and visualize profile data
By default, you will notice that a new profile is created with two data points with a value of 1. Now, we will edit the profile data points in the profile data table (section 2). Under the Mean column, enter the corresponding data points for the PRF_DEM provided in Table 1.
You can edit profile data points manually by selecting the desired cell, then overwriting the value and pressing Enter to save the new value in the cell. Press Down to select the following row and repeat the process. However, once you are adding new data points to the profile data series pressing Enter will automatically jump to the following cell.
Click here to view profile data.
| PRF_DEM | PRF_WIND | PRF_NG_GEN1 | PRF_NG_GEN2 |
|---|---|---|---|
Mean |
Mean |
Mean |
Mean |
162.5 |
12.5 |
100 |
50 |
150 |
6.25 |
110 |
33.75 |
137.5 |
0 |
100 |
37.5 |
125 |
0 |
90 |
35 |
125 |
0 |
90 |
35 |
137.5 |
6.25 |
100 |
31.25 |
150 |
0 |
120 |
30 |
175 |
18.75 |
125 |
31.25 |
200 |
12.5 |
120 |
67.5 |
212.5 |
6.25 |
130 |
76.25 |
225 |
18.75 |
150 |
56.25 |
225 |
25 |
150 |
50 |
212.5 |
37.5 |
125 |
50 |
200 |
50 |
110 |
40 |
187.5 |
25 |
130.5 |
32 |
187.5 |
18.75 |
135.5 |
33.25 |
200 |
37.5 |
132.5 |
30 |
212.5 |
12.5 |
150 |
50 |
237.5 |
6.25 |
150 |
81.25 |
250 |
31.25 |
150 |
68.75 |
237.5 |
25 |
150 |
62.5 |
212.5 |
12.5 |
150 |
50 |
187.5 |
25 |
120.5 |
42 |
170 |
19 |
110.75 |
40.25 |
4. Include profile data
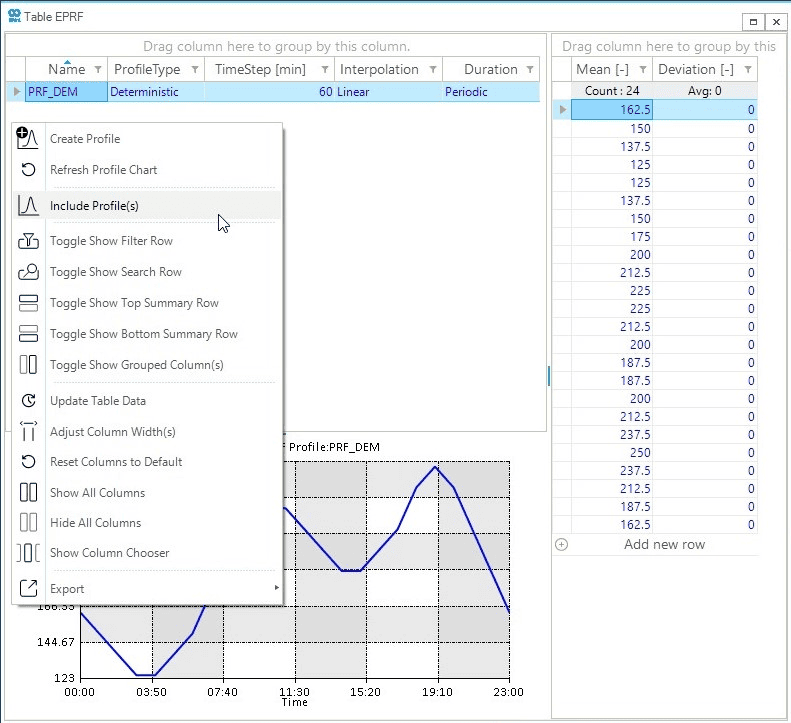
Instead of repeating the same manual process for the other two profiles, we will use the include feature to input the profiles from an existing profile file (.prfl). Before continuing with the following steps, make sure you have a copy of the file "profile_data.prfl" from the tutorial directory which includes the profile data for NG_GEN1, NG_GEN2, and WIND_GEN3. In the profile description table, right-click on the blank space and select Include Profile(s) (Figure 2). This will open a window asking which profile file to open. Locate the profile file from the zip folder and press Open. A prompt that the profiles have been successfully loaded should appear. Press OK or close the window to continue.
We can now observe that three new profiles have been included to the scenario file. The PRF_WIND, PRF_NG_GEN1, and PRF_NG_GEN2 are hourly scheduled supply profiles with TimeStep of 60 minutes.