Evaluate data
This tutorial focuses on the IronPython scripting in the script editor of SAInt GUI. It explains the procedure for developing scripts using SAInt built-in functions to evaluate input properties and results. The IronPython scripting language can be used in SAInt GUI to automatize data analysis and processing tasks. Benefits of using IronPython’s notable features include:
-
Easy to develop user-defined functions.
-
High-level programming language and easy to read syntax.
-
Access to all network objects and properties.
-
Usage of built-in SAInt commands (e.g., plot, table, eval, etc.).
-
Usage of third-party modules.
1. IronPython script in the script editor
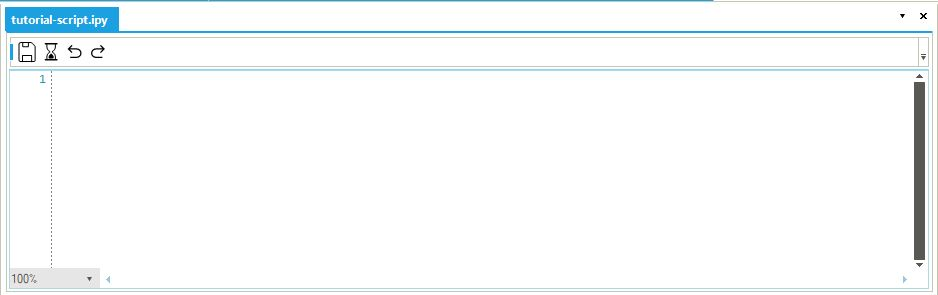
SAInt GUI has an integrated script editor which can be used to write and execute scripts. After execution, the results are displayed in the command window and the variables are saved in the workspace of SAInt GUI. To create a new IronPython script, click on from the view tab. A new script editor appears as a tabbed document (Figure 1). Click on  to save the script to a user-defined location. For executing the script, click on
  .
.
|
An existing IronPython script can also be loaded into SAInt GUI by clicking from the view tab. |
2. SAInt built-in functions
SAInt has various built-in functions to be used in the script editor and command window. In the Visualize Data and Analyze Data tutorials, we learned how to use the plot and table functions in the command window. In this tutorial we will use some of the other built-in functions in the script editor to evaluate different kinds of results.
|
Please refer to the evaluation functions section of the reference guide to learn more about the evaluation functions' syntax, input and return expressions. |
2.1. esum function
SAInt has built-in evaluation functions, such as eval, esum, emax, emean, ecount, etc., which are used to evaluate and aggregate input properties and results to understand the behavior of an object over a specified time step or scenario time window. In the following example, we will use the esum function to evaluate the total active power generation, total active power set point, and total active power compensation at the network level. To do this, copy and paste the following commands into the script editor and execute.
esum('ENET.PG.[MW].(%)')-
Returns the total active power generation of the network: 4564 [MWh].
esum('ENET.PGSET.[MW].(%)')-
Returns the total set power set point: 4520 [MWh].
esum('ENET.PGSET.[MW].(%) - ENET.PG.[MW].(%)')-
Returns the total active power compensation -44 [Mwh].
|
Figures are for the scenario QDYN_ACPF with "Active Power Compensation Mode" set to PART. |
2.2. emax function
The emax function can be used to evaluate the maximum value of an object parameter. We can use this function to determine the peak power demand of the network and the maximum power supplied by generator NG_GEN2. Copy and paste the following commands into the script editor and execute:
emax('ENET.PDSET.[MW].(%)')-
Returns the peak power demand of the network: 250 [MW].
emax('XGEN.NG_GEN2.P.[MW].(%)')-
Returns # Maximum power supplied by NG_GEN2: approximately 82.1 [MW].
2.3. gmax and gmaxat functions
SAInt’s built-in graphical functions return graphical data that can be used with the plot and table functions to plot and tabulate aggregated results and input properties. To check which electric line has the maximum line loading in terms of apparent power at each time step of the simulation, we will use the gmaxat and gmax graphical functions with the table function. Copy and paste the following command in the script editor and execute:
table(gmaxat('LI.%.LLS.(%)'),gmax('LI.%.LLS.(%)'),'01/01/2023 01:00','02/01/2023 00:00')-
The result of the above function is a table. The
gmaxatfunction returns theObjectIDof the particular electric line that has the maximum line loading, while thegmaxfunction returns the value of the maximum line loading, at each time step of the simulation.