Step 3: Extract Simulation Results Data for the Electric Storage Object
In the previous steps of this beginner tutorial, you have learned how to add an electric storage object to a node, edit the storage events within a scenario, and execute a DCUCOPF simulation. The next step in modeling a storage object in SAInt is to extract and plot the scenario results for object. This step will focus on extracting results data for the storage using plots and tables. The objective is to understand the state and cycle of a storage object. The network used in this tutorial is the electric network ENET09_13 available in the sub-folder .\Energy Markets\ENET09_13 of the folder Tutorials.
1. Display storage results data using a plot
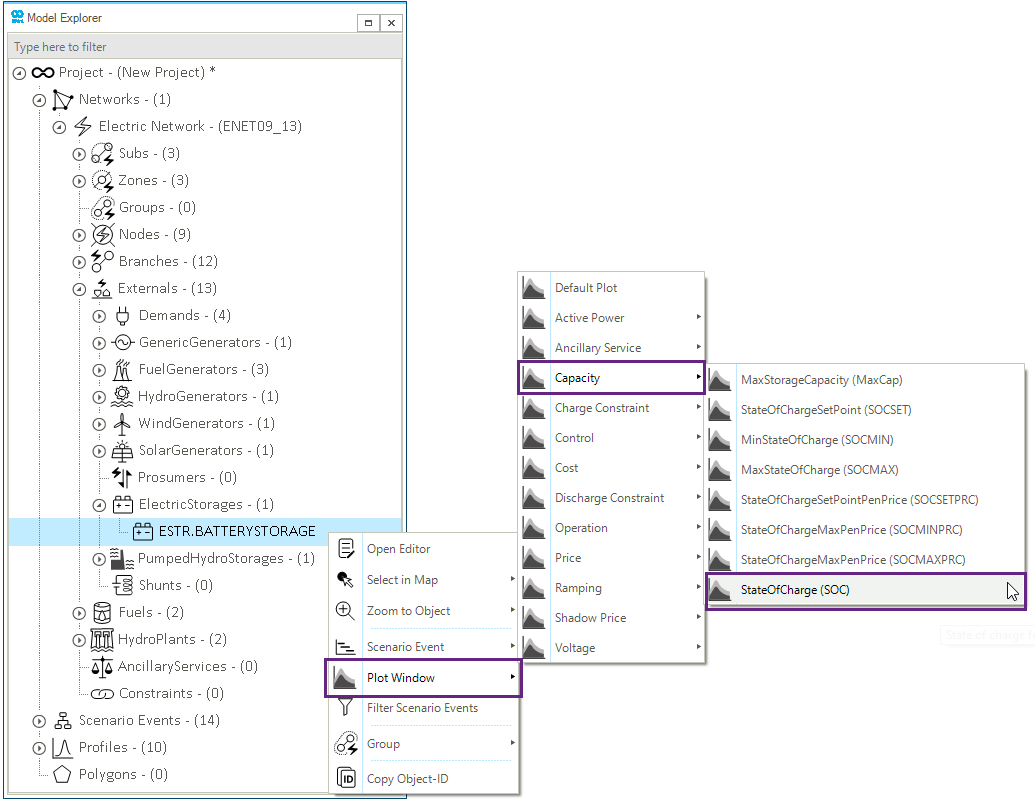
After solving the DCUCOPF scenario, you can now plot some results for the storage. From the model explorer, right-click on the ESTR object BATTERYSTORAGE. Select to display the storage’s state of charge, as shown in Figure 1.
The displayed plot shown in Figure 2 describes how the state of the battery varies during the optimization horizon.
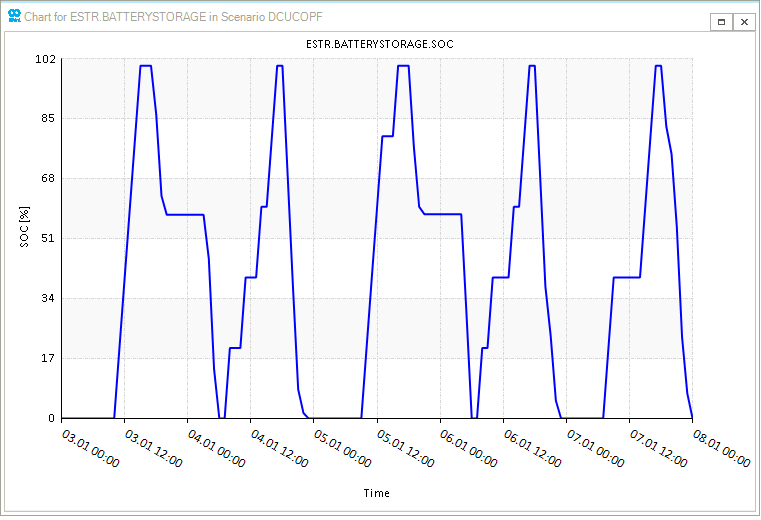
Alternatively, you could have used the following command in the command line where you better control the intervals of the y-axis and the title.
plot("ESTR.BATTERYSTORAGE.SOC;blue;[100,0,10];title=State of Charge")
2. Display the storage results data using a table
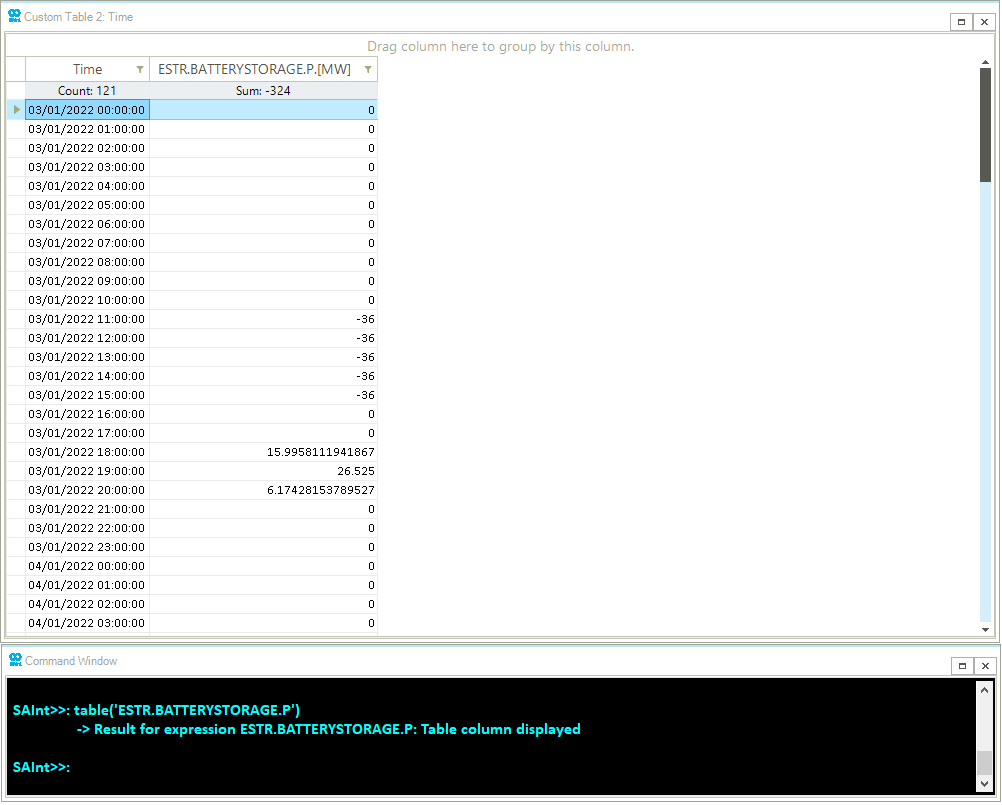
To get further information about the operation of the battery, you can see the charging and discharging power in each timestep by entering the following command in the command window the following command as shown in Figure 3.
table("ESTR.BATTERYSTORAGE.P.[MW]")