Step 4: Build a Steady State Scenario
In the previous steps of this beginner tutorial, you created a simple T-shaped gas network with three pipelines, one regulator valve, one supply point, and three demand points. Now, you will complete the model with a scenario to simulate a system’s possible steady state condition. This step will describe how to set up a steady state scenario and add events in SAInt to influence the model’s behavior.
|
If you closed SAInt at the previous step and saved your work, you can restart from where you left off by following these steps:
|
1. Scenario creation
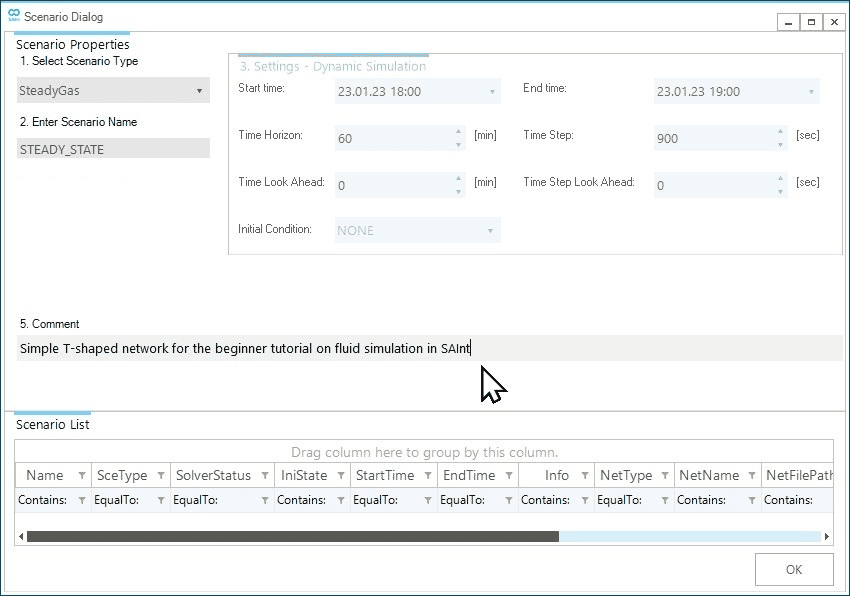
Create a new scenario by going to the scenario tab and selecting . This will open the scenario dialog window, where you will define the parameters and settings of the scenario. The first step is to define the scenario type in the top left corner under 1. Select Scenario Type click on the drop-down menu and select SteadyGas. Under the 2. Enter Scenario Name enter STEADY_STATE as shown in Figure 1. You can enter a short description of your new scenario in 5. Comment. The scenario name will also be used to name the scenario file. In this case, the file will be named STEADY_STATE.gsce. Once completed, click OK at the bottom of the window. A prompt will show up that indicates the scenario was created successfully. Close the window or press OK to continue.
2. Add events for the demand points
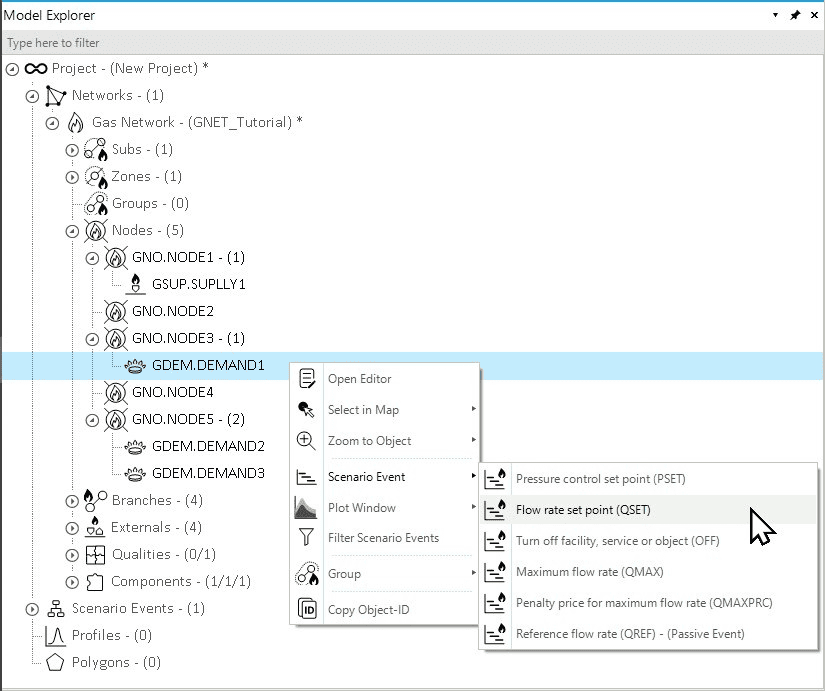
The first step is defining the characteristics of the demand points in the system. Select the object GDEM.DEMAND1 in the model explorer, and right-click to access from the context menu as in Figure 2. A new window opens where you can define the properties of the event. Set Value to 100 ksm3/h. Leave all other properties to their default values.
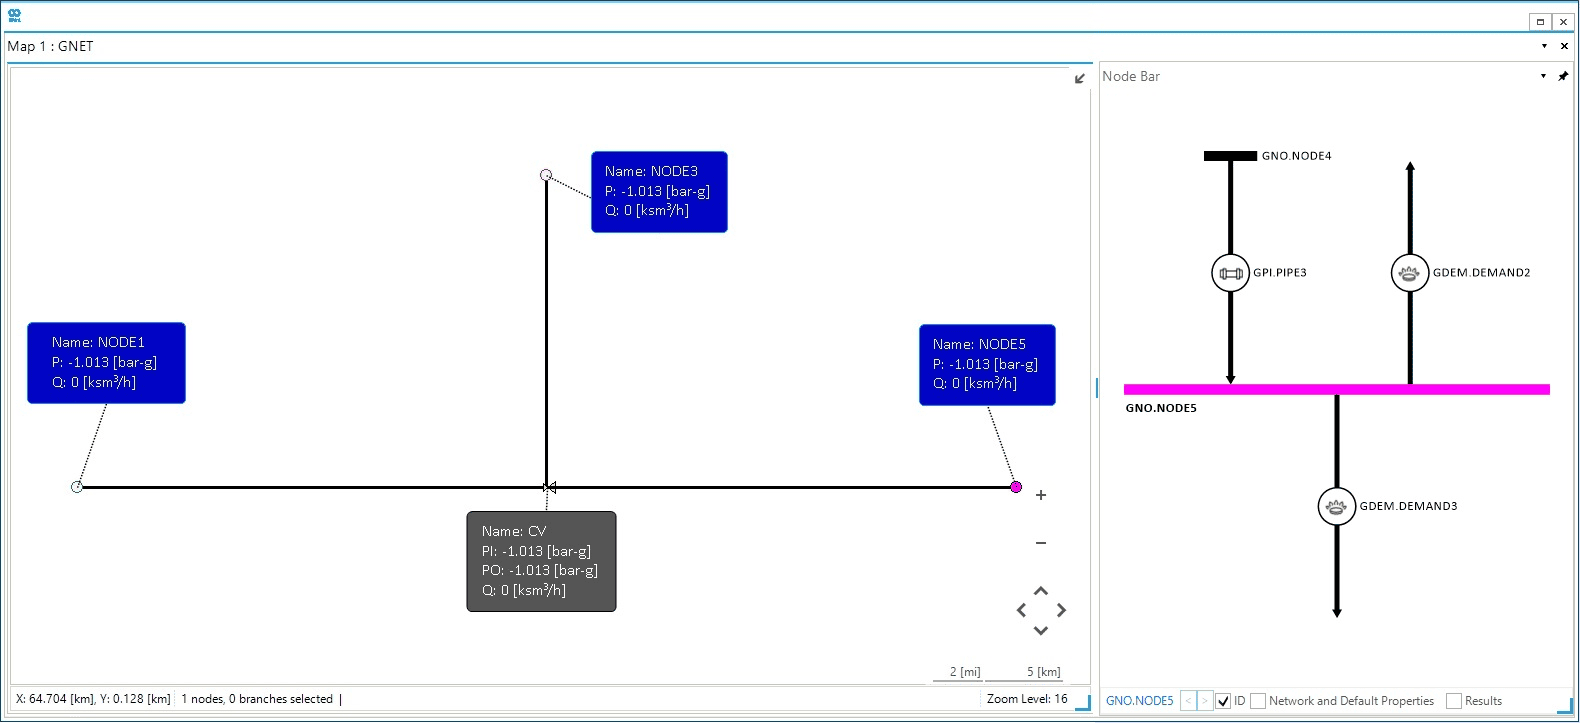
Now select the object GNO.NODE5 in the map window and check the content of the Node Bar. You will see all external and branches connected to the node as in Figure 3. Select one of the demand objects and right-click to access from the context menu. In the event property window, set Value to 80 ksm3/h. Leave all other properties to their default values. Repeat for the additional demand point, and set Value to 20 ksm3/h.
|
You can always select a node in the map view and see all externals and branches linked to the node in the Node Bar. |
3. Add an event for the supply object
Define the characteristics of the supply point in the system. Select the object GSUP.SUPPLY1 in the model explorer (or from the node bar), and right-click to access from the context menu. Set Value to 40 bar-g. Leave all other properties to their default values.
4. Add an event to the control valve
Finally, specify the status of the control valve. If you don’t set anything, SAInt will default the status of the control valve to a bypass control mode. Select the control valve CV (either in the model explorer or in the map view) and right-click to access from the context menu. Change Value to 30 bar-g. Leave all other properties to their default values.
|
The control valve separates the system into two hydraulic subsystems. For each subsystem, you need to have at least one pressure control point and one flow control point. For the subsystem composed by GNO.NODE1, GNO.NODE2, and GNO.NODE3 and the connected pipelines, GSUP.SUPPLY1 defines the pressure, and GDEM.DEMAND1 the flow. For the remaining subsystem, this is done by the control valve’s outlet pressure and the demands at GNO.NODE5. |
5. The scenario events table
The event table can be used to review, filter, and edit scenario events. Open the event table by going to the scenario tab and clicking on GEVT. Once opened, you should view a table with five events like in to Figure 4. Following, edit the event properties in the table or by right-clicking accessing the property editor. After calculating a feasible solution, you can generate charts for the particular event. Or we can delete the event from the scenario.
If you don’t like the units of measure for a specific event, you can change them by selecting the event, right-clicking on the unit, and selecting the new one from the context menu. SAInt will convert the value for you.

|
The column |