Customize Node Display Settings
This guide explains how to customize the node display settings to show the results of node properties on the map window. Unlike the branch legend, the node legend is active only when a solved scenario is loaded, allowing the visualization of simulation results at the node level. A user can personalize the node legend from the settings using colors and size classes. How to add a new class, edit the colors, and display the node legend are explained in this guide. A gas network is used in the examples. However, the same method can be used for all energy networks (electric, thermal, etc.).
1. STEP 1: Access the node legend color settings window
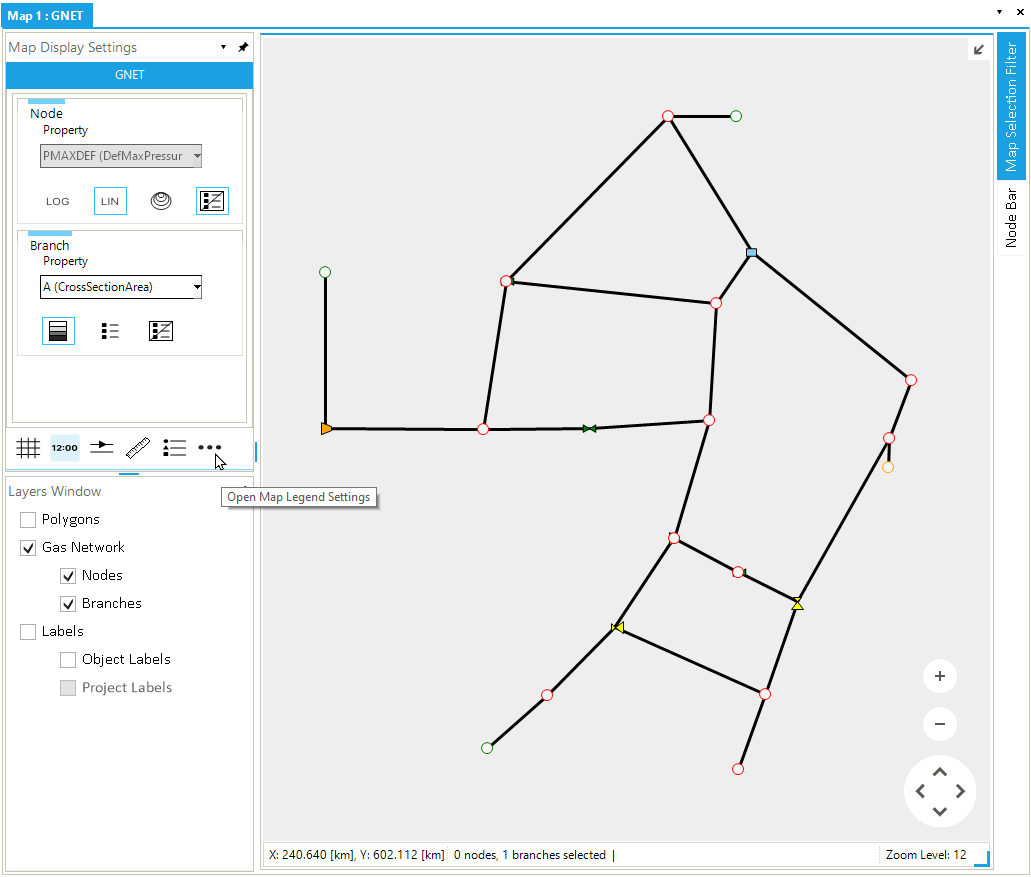
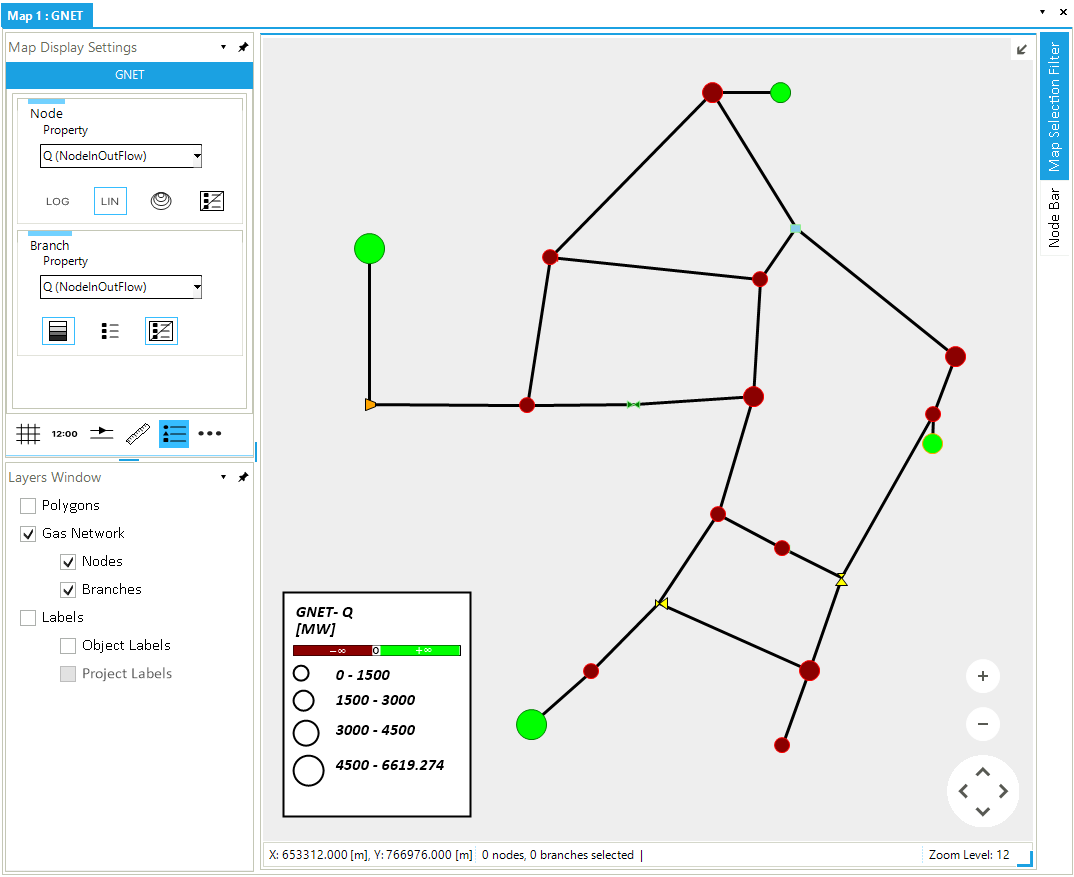
Open a network and a solved scenario (e.g., network GNET29_18 and scenario "STE_0_wT"). Click on the three dots button at the bottom right of the map display settings to access the node display settings window, as shown by the mouse pointer in Figure 1.
Make sure to duplicate the selection of the options of the "Layers Window" and "Map Display Settings" (i.e., checked boxes and blue border for the icons) to replicate the figure. Remember to active "Turn On/Off Network Legend Settings" (i.e., the icon on the left of the three dots button) to visualize the node legend in the remaining steps.
|
The "Map Legend Settings" window can also be accessed by clicking on the Home button of SAInt and selecting " Settings" from the context menu. |
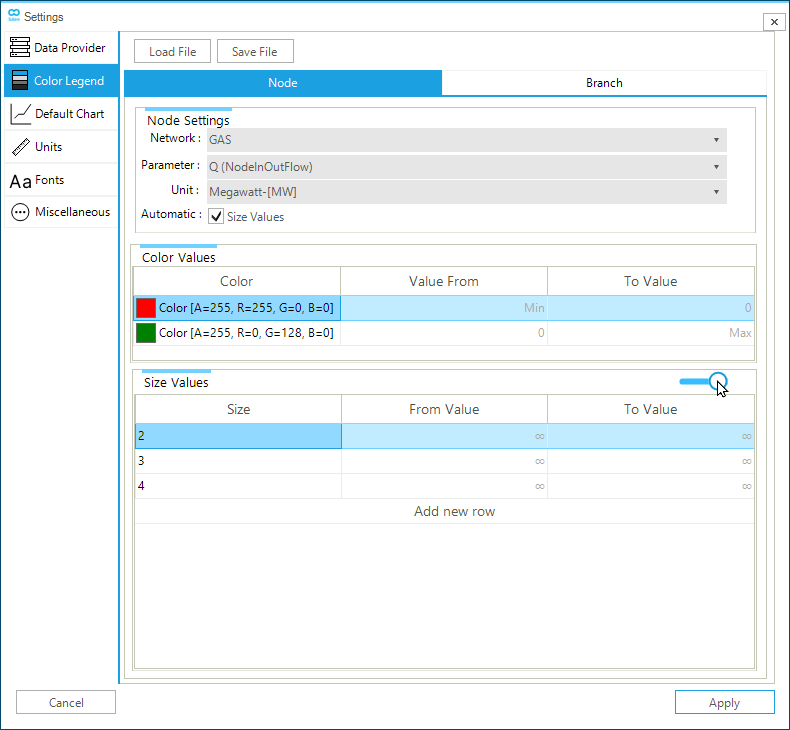
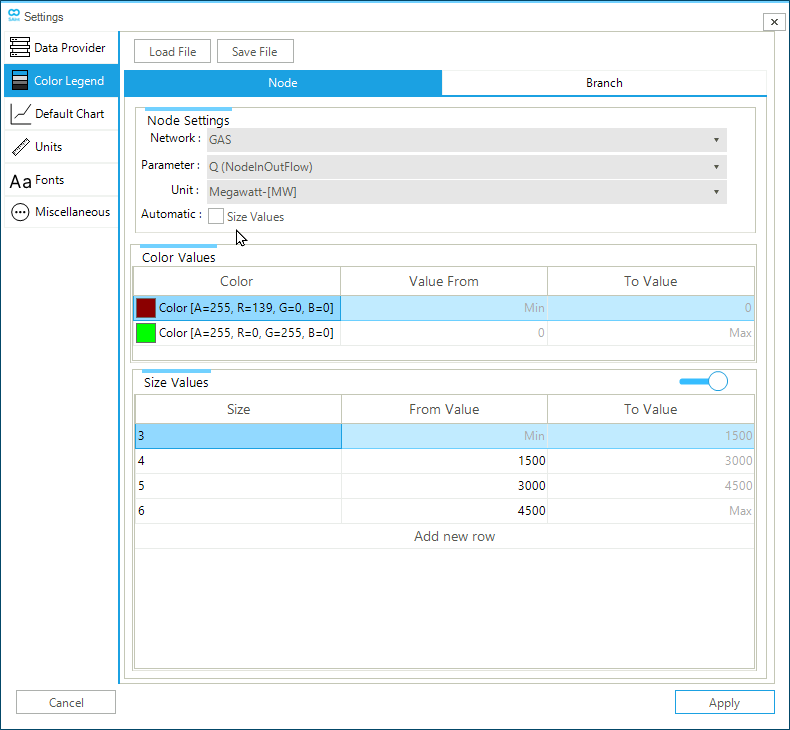
Alternatively, from the general settings of SAInt (i.e., blue button on the top-left side of the main window) select the tab "Color Legend". From there, select the tab "Node" to access the node color legend settings (i.e., see Figure 2).
2. STEP 2: Define the node settings
The "Node Settings" of the color legend tab for a node allows to specify the settings for the selected network type, the node parameter, and the unit of measure to be used in the legend by means of drop-down menus. Select "GAS" in "Network", "Q (NodeInOutFlow)" in "Parameter", and "Megawatt-[MW]" in "Unit", like in (Figure 2).
If you don’t specify size classes, SAInt uses only one size symbol. Use the slide bar on the right of the "Size Values" section to activate the option. See Figure 2 for details.
When clicking on the button Apply, the node legend is updated and now represents nodes in red (negative values) and green (positive values) over three size classes.
|
Changes to the legend settings are visualized only if the same property is selected in the settings and in the "Map Display Settings". |
3. STEP 3: Change the node filling color
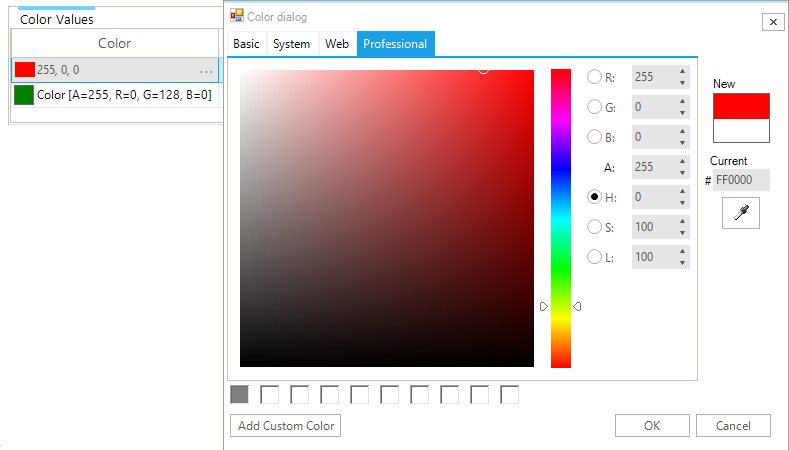
The user can change the filling color of the nodes for the selected class by opening the "Color Dialog" window from the three dots symbol available when clicking on the existing color (Figure 3). The node legend only includes the definition of two colors: one for negative values and another for positive values. By default, a white color filling is used for values equal to zero. When values are either only positive or negative, only one color is used.
Please select the colors "Dark Red" and "Lime" for negative and positive values with the "Web" tab of the "Color dialog".
4. STEP 4: Change size values and number of classes
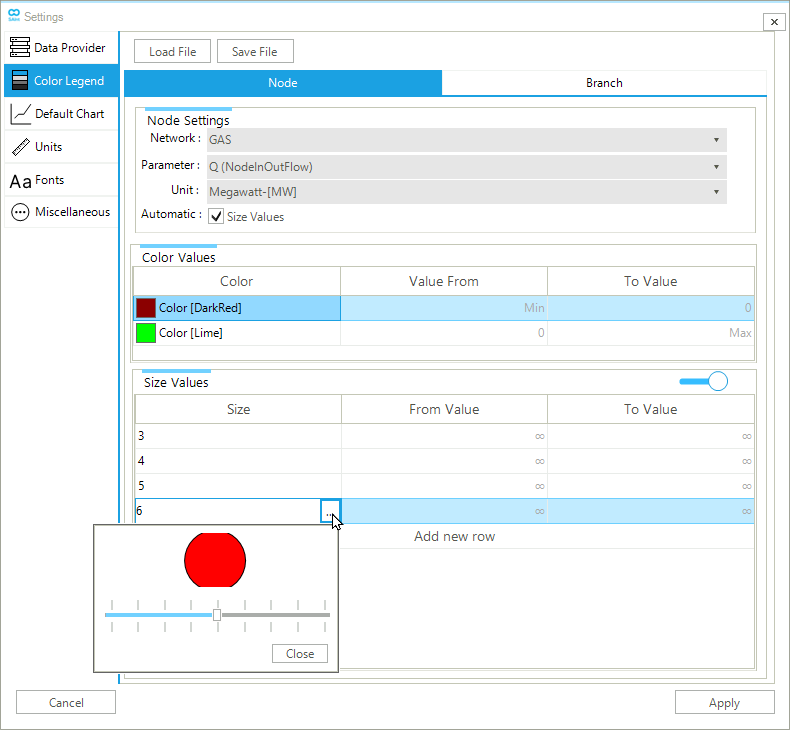
The scroll bar on the right of the section "Size Value" (Figure 1) enables to specify the size of the nodes based on user-defined or equally-spaced size classes. Click on Add new row to add a new class. To define the size of the symbol of a class, from the "Size Values" section, select the class and click on the three dots available on the right of the cell. Use the cursor to increase or decrease the size, then click on Close to apply the change (Figure 4).
Add a new class and set the sizes as shown in Figure 4. Once all the parameter settings have been defined, click on the Apply button to save the changes.
|
If the "Size Values" option is inactive, all the nodes will have the same size on the map window. |
5. STEP 5: Personalize class ranges
To define the values range of the size classes the user can enter the "Value From" and "To Value". The figures used must be non-negative because SAInt calculates the size based on the absolute value of the displayed property. The sign of the value is indicated by the filling color.
The cells "Value From" and "To Value" are active only if the box "Size Values" for the option "Automatic" in the "Node Settings" section is unchecked. Otherwise, SAInt will use equal ranges.
The first and last class will have the "Value From" and "To Value" fixed to the minimum and maximum of the absolute value of the property, respectively. These are automatically computed by SAInt and cannot be changed by the user.
Q (NodeInOutFlow) for a steady state scenario of a gas network.