Create a Profile in SAInt-GUI
This guide explains how to create a profile directly in SAInt GUI. A profile is a collection of temporally equidistant data points and are assigned to object properties through events. A profile can be created in SAInt GUI only in the profile table, but can be modified either in the profile table or in the property editor. How to delete an existing profile is also explained. In this example a gas network is considered, however, the same method can be used for all energy networks (electric, gas, thermal, etc.).
1. Create a profile using the profile table
It is necessary to have a network and scenario loaded. Under the scenario tab, select the profile table (GPRF) to open the table window. The table window is empty if no profiles have been created.Right-click in the table to access the context menu and select Create Profile to create a default profile.
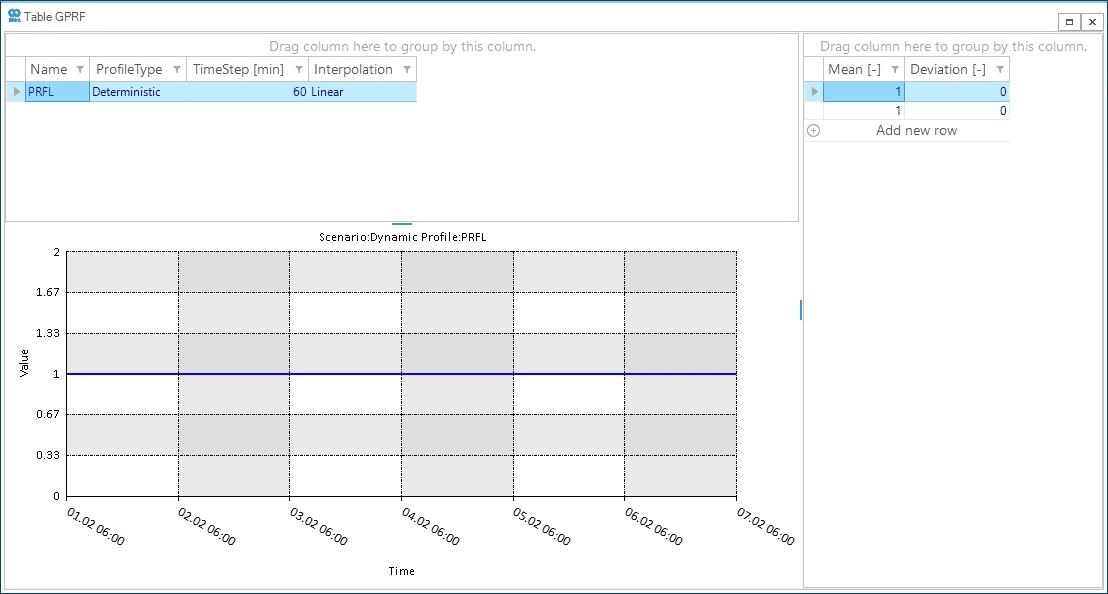
The default profile is created with "PRFL" as Name, and it has 2 data points with the Mean property equal 1 as shown in Figure 1. In addition, the Duration (not visible if the column has not been chosen) property of the profile is, by default, periodic. Therefore the Mean value is kept the same (equal to 1) for the whole time window.
2. Edit a profile
It is possible to edit the profile properties (e.g., Name, ProfileType, Timestep, Duration, etc.) directly in the profile table or using the profile property editor.
2.1. Edit profile data points using profile table
Left-click to select the cell containing the Mean value (in this case 1) and type the new value, and press Enter. Alternatively, right-click on the cell and can select Edit Value from the context menu. To add more data points click on Add new row, define the new value and press Enter to save the value.
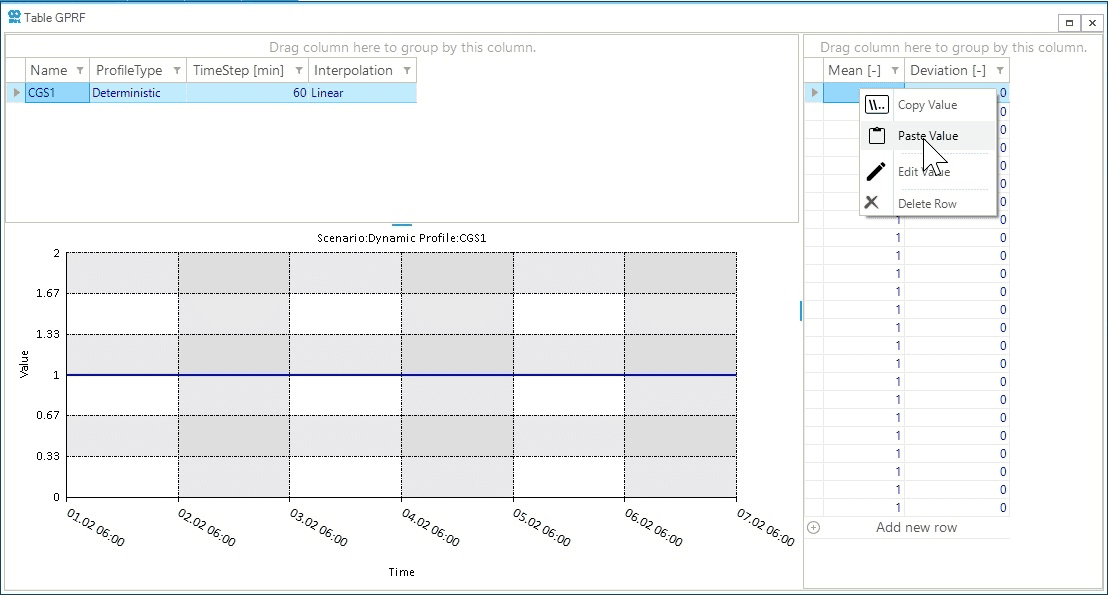
In addition, to add multiple data points in one step, the user can copy one column from Microsoft Excel. For this method to work the number of rows in the profile table and the Excel data must match. First add the required number of rows to the profile then copy the data from Microsoft Excel, right-click on the first cell of the event table and select Paste Value to paste the profile data into the SAInt GUI as shown in Figure 2.
2.2. Edit profile data points using property editor
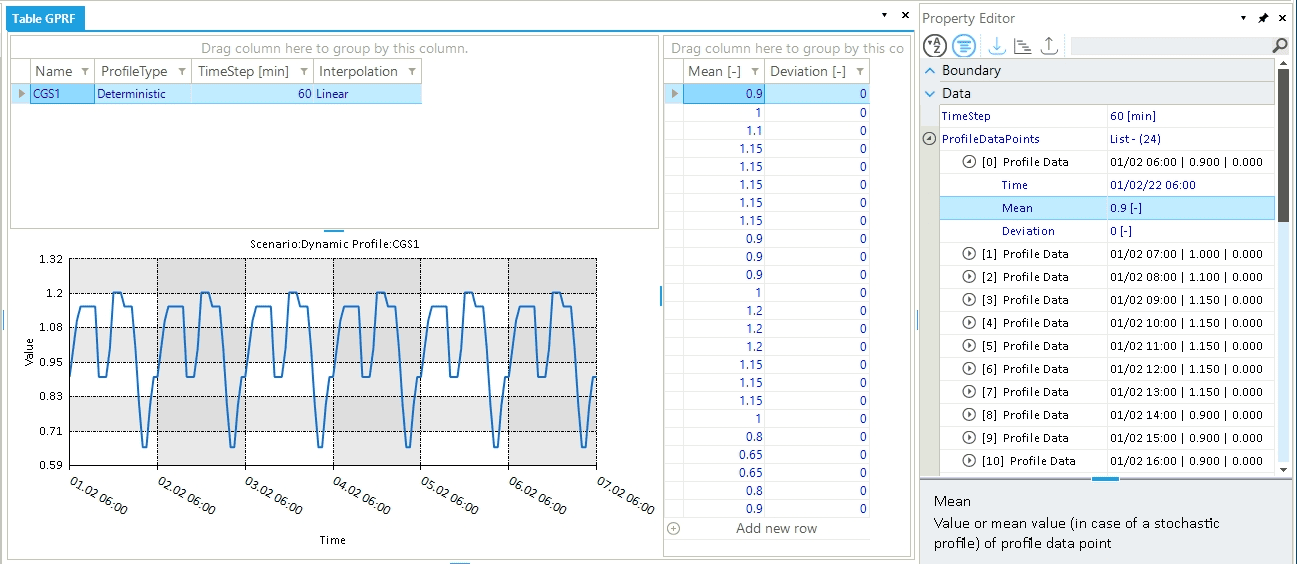
Select the profile in the profile Table. Go to the property editor, and expand the ProfileDataPoints to see the Time, Mean, and Deviation for each data point. Access the Mean property and type the new value as shown in in Figure 3.
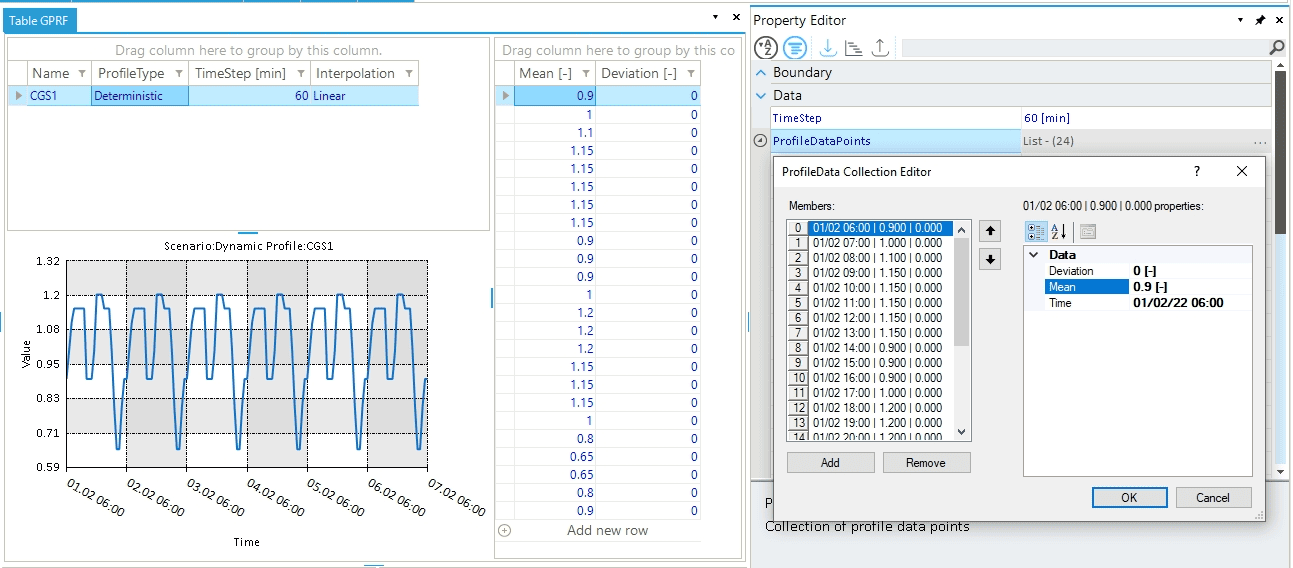
Another option to add, remove or edit data point is by using the profile data collection editor window. Go to the property editor, and left-click on the additional options (…) of the ProfileDataPoints property. This will open the collection editor window that allows to customize the data points of the profile as shown in Figure 4.
3. Delete a profile
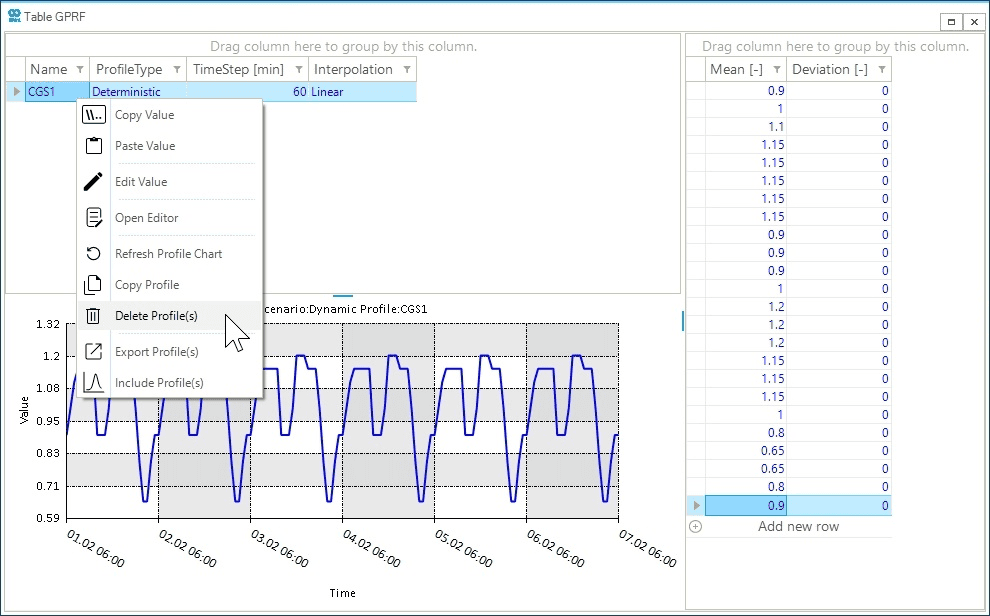
In the profile table, right-click on any cell of the profile to access the context menu. Select Delete Profile(s) to remove the profile as shown in Figure 5. To remove multiple profiles, hold the Shift while selecting the rows (profiles) and replicate the above instructions. A similar process can be done in the model explorer under the profile section.