Template Files
Template files are provided for convenience and can be used to create input files at the network and scenario levels. The template files are either Microsoft Excel© (*.xlsx, *.xls), text files (*.txt) or shapefile files (*.shp). SAInt makes a distinction between:
- Multi-sheet format
-
The only true multi-sheet format container available in SAInt is an Excel document. An Excel file allows having multiple sheets to organize the input data. Each sheet represents a type of object. In a sheet, each column describes a property of the object, while each row indicates a new object of that type. The first row shows all headers of the columns, with default values and units. This format is recommended for large and complex datasets with many network objects, events, or profiles. For quality data, it is possible to have a multi-sheet format in text file, though the Excel file alternative is preferred.
A shapefile dataset is like a multi-sheet file, because it allows to have different types of linear objects in the same file (e.g., pipelines, valves, compressor stations, etc.). It is also possible to manage the attributes of the geometric objects like in a spreadsheet. But it is less user-friendly, and it is specifically designed for geographic data (i.e., where the location and the shape of the objects are important).
- Single-sheet format
-
A single-sheet format file is a container that holds data for objects of a single class or entities of the same type (e.g., events of a scenario). It is possible to organize the data in either a text file (i.e., a
*.txt) or in an Excel file (*.xlsxor*.xls). For an Excel file, all objects are on the same sheet, and only one type of object can be present (i.e., only one sheet with data). This format is recommended for smaller and simpler datasets with a limited number of network objects, events, or profiles.
The templates are available in the DataImport directory. The structure of the DataImport directory may change between releases, so take the time to have a look at it. The following sections are based on the structure of the DataImport directory.
|
|
Microsoft Excel has many user-friendly built-in procedure that automatically change the format of the data in a cell. Just consider the case of time and date formats, for which Excel uses the general settings of your operating systems. When preparing data for SAInt using an Excel template, please make sure to respect the required format. |
1. Network template file
A network template file is a multi-sheet Excel spreadsheet file. It allows designing a network by specifying all its characteristics, the full list of objects to include, and their properties. A network is independent of the scenario type implemented in a simulation, and therefore there is no scenario-related information in the template. Figure 1 shows the four templates available in the directory Network of the folder DataImport. They are the template for an electric network (*.ENET, middle-top), the template for a gas network (*.GNET, middle), the template for a thermal network (*.TNET, middle-bottom), and the template for a hub system (*.HUBS, bottom).
The structure of a template is the same for all types of networks. The first two sheets report the list of extensions with displayed names and descriptions (the INFO sheet) and the list of units of measurement with descriptions and aliases used in all other sheets (the UNITINFO). Then, there is a set of sheets for the containers. The sheet name depends on the type of system and its content on the type of object. There are four sheets: a network sheet, a subset sheet, a zone sheet, and a group sheet. The remaining template sheets cover the objects of the specific network type. There is a sheet for nodes and another for each type of supported branch. Finally, there could be sheets covering other aspects of a network like gas quality in gas systems or ancillary services in electric systems. The POLY sheet at the end represents vertices in branches describing bending lines and turns.
Except for the first two information sheets, all the remaining ones share a common structure: a header row and data rows. The data rows are empty as the user is supposed to fill in the data. The header row reports the column’s name based on a predefined format: object "extension", the unit of measurement, the symbol =, and a numerical/Boolean value to be used as reference. Default units and values are used if only the extension is reported. When it comes to the extension Name only the name of the object is required.
SAInt automatically checks the header. If the header format is not respected, it returns an error for the import process. The user is informed to take action.
Custom column headers and sheets are allowed in the network import template. SAInt will not take them into account during the import procedure. The details of what has been taken into consideration and what not is logged for the user.
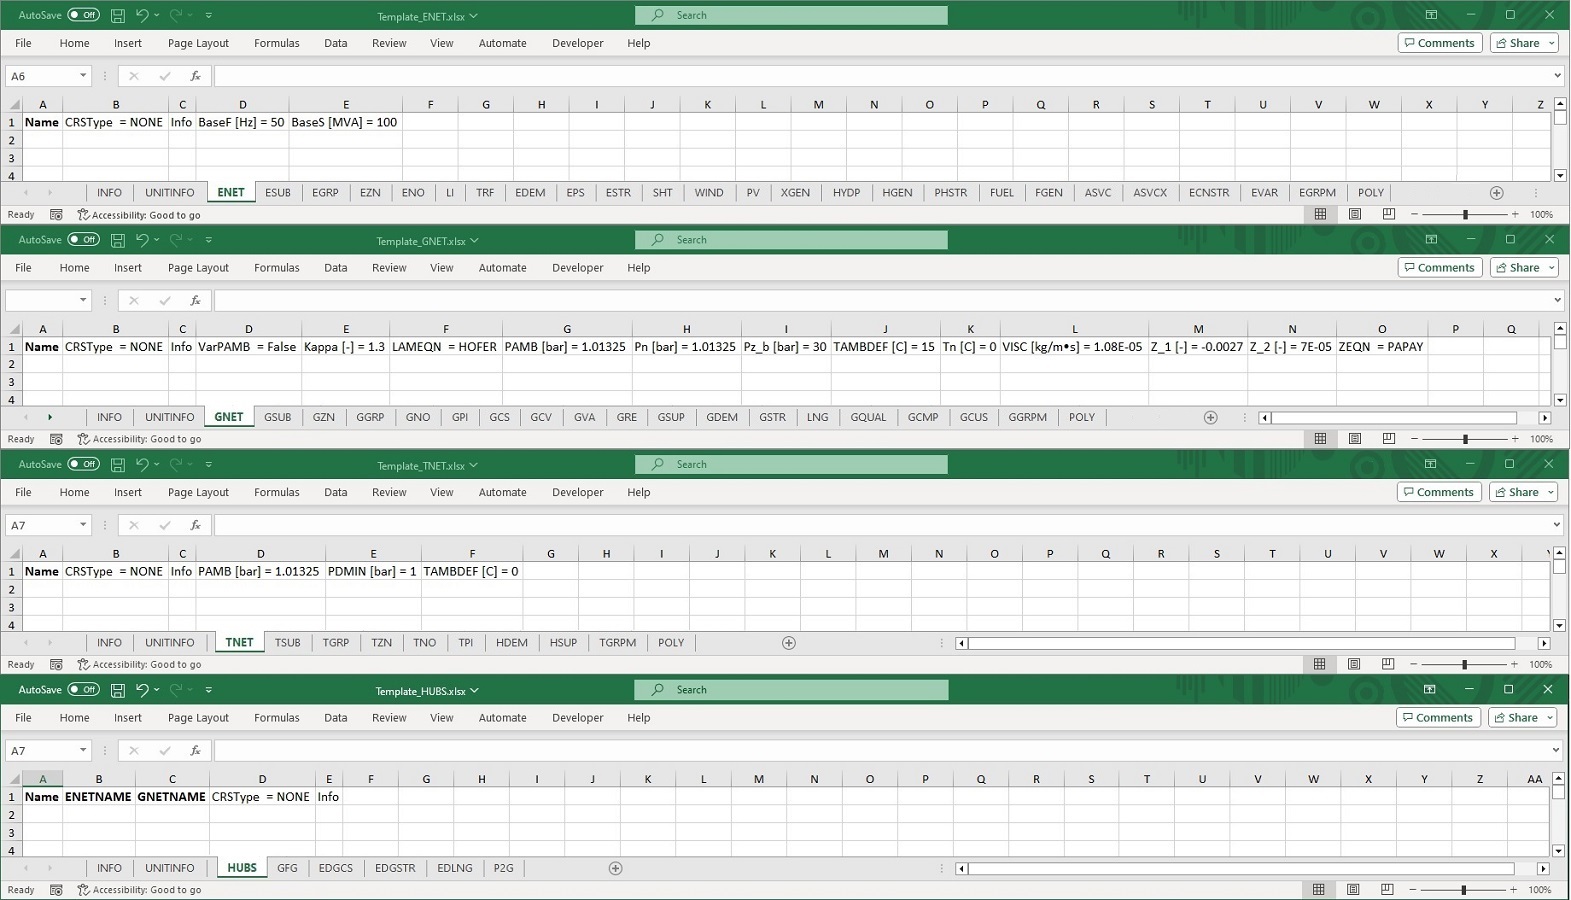
The file Template_ENET.xlsx allows the creation of a network import file of an electric network. The file Template_GNET.xlsx allows allows the creation of a network import file of a gas network. The file Template_TNET.xlsx allows allows the creation of a network import file of a thermal network. The file Template_HUBS.xlsx allows allows the creation of a network import file representing an HUB system. An HUB system combines different types of networks, and it defines which objects are coupled (i.e., using HUB objects) between the network types. A HUB system requires to create — at least — two separate networks (e.g., an *.ENET and a *.GNET), and after specifying the HUB objects.
For a detailed description of the network’s objects and their properties, please check the section "Electric Objects", the section "Gas Objects", the section "Thermal Objects", and the section "Hub Objects".
|
Even if an *.ENET file is applicable for different scenario types, objects and properties are different per scenario type. For example, a transformer object (TRF) is treated as an electric line (LI) in a DCUCOPF scenario, while it is treated as a transformer in an ACPF scenario. Reactive power is not considered in a DCUCOPF scenario, but it is for an ACPF scenario. |
2. Profile Template
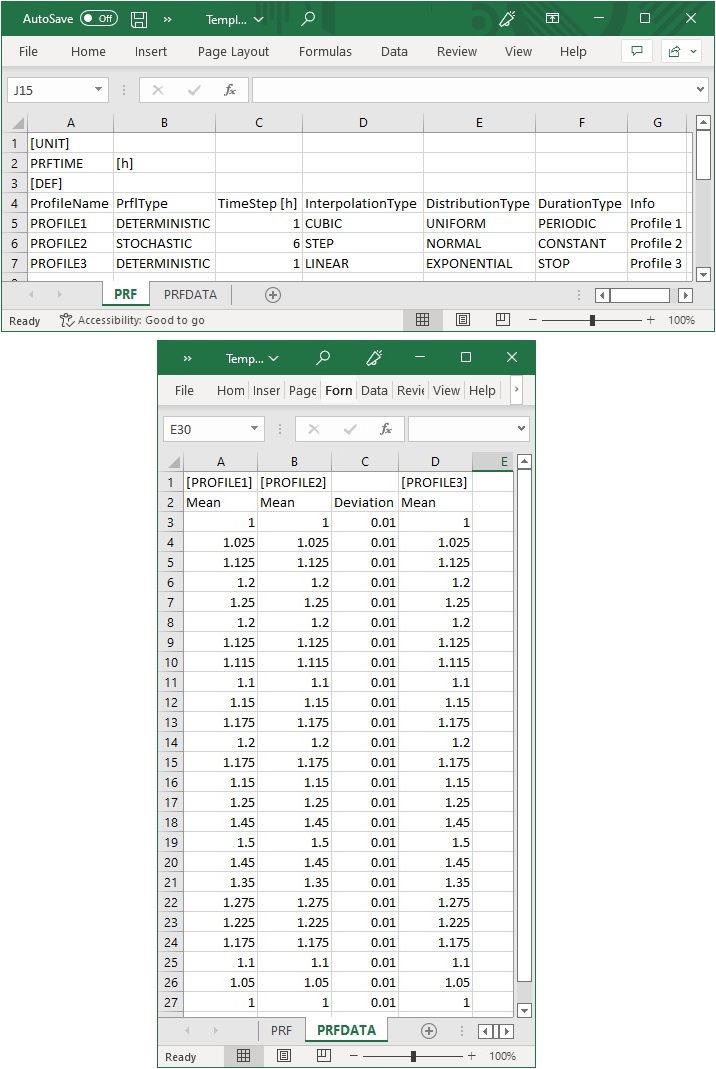
Profiles can be imported into SAInt by single-sheet format files either in Excel or in text format. The Excel file Template_Profile_Import.xlsx is, probably, the easiest options, because it constraints the user to follow a clear predefined layout, and quickly organize the data in a spreadsheet. Figure 1 describes how the data for three different types of profiles must be organized in two sheets named PRF and PRFDATA.
The example shows three hourly profiles (see the PRFTIME parameter set to [h]), called PROFILE1, PROFILE2, and PROFILE3 (see the ProfileName property). All general properties of a profile are reported in PRF. PROFILE1 is a deterministic profile, with a timestep of one hour, a cubic interpolation between steps, and its duration is set to periodic. The Info property can hold any additional piece of information deemed useful by the user. For this profile, the property DistributionType is not relevant and set to UNIFORM to showcase the three most common distribution types in SAInt (i.e., uniform, normal, and exponential distribution). The actual values of a profile are reported in PRFDATA. There profiles are organized in columns, starting with the name in square brackets in the first cell, followed by the label Mean or Deviation, and the numeric values of the profile steps. The label Mean is used for all types of profiles, while Deviation must be specified only for stochastic profile types.
Alternatively, a text file template can be used. The structure of the template mimics the one in an Excel file. The file starts with the information of the PRF sheet, and it reports sequentially the values of each profile. See the following example. Please, remember that cells with any value are separated by a tab.
Example: Single-sheet format example in text format. The sequence "->" represents a TAB. A line starting with % indicates a comment.
[UNIT]
PRFTIME -> [h]
[DEF]
%ProfileName -> ProfileType -> TimeStep -> Interpolation -> Distribution -> Duration
PROFILE1 -> DETERMINISTIC -> 1 -> CUBIC -> UNIFORM -> CONSTANT
PROFILE2 -> STOCHASTIC -> 6 -> STEP -> NORMAL -> PERIODIC
PROFILE3 -> DETERMINISTIC -> 1 -> LINEAR -> EXPONENTIAL -> STOP
[PROFILE1]
1
1.025
...
1.05
[PROFILE2]
%MEAN -> DEVIATION
1.125 -> 0.01
1.115 -> 0.01
... -> ...
1.05 -> 0.01
[PROFILE3]
1
1.025
...
1.05
|
If the user imports a duplicate of an existing profile, SAInt creates a new copy and modifies the name of the imported instance appending |
3. Scenario events template
Scenario events can be imported into SAInt by single-sheet format files either in Excel or in text format (e.g., text TAB delimited *.txt files, or text comma separated *.csv files). In the Scenario directory of the DataImport the user can find the Excel templates. Examples of the other formats can be generated by exporting a scenario created in SAInt and checking the structure. The Excel template is the preferred solution as it is very easy to use, adapt, and process.
A scenario events file allows creating a list of events for any object in the active network and defining its relevant properties. The available events depend on the type of network considered.
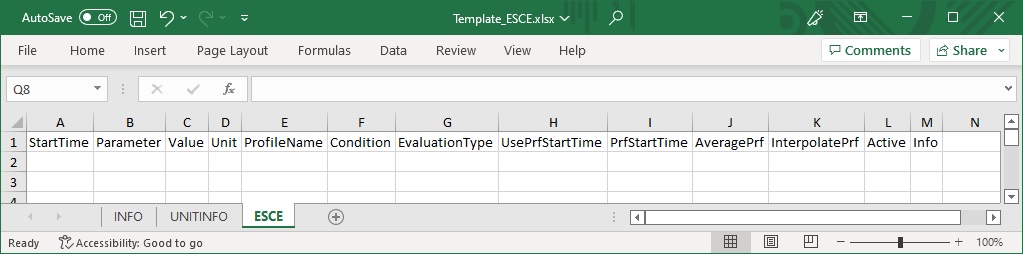
The Excel file Template_ESCE.xlsx is designed to create an electric scenario. Figure 3 shows an empty template. The same ESCE is used for all the electric scenario types (SteadyState, QuasiDynamic, and Dynamic). The information needed is:
Details
- StartTime
-
It indicates the start time of the event, expressed as
+N, whereNis a positive real number indicating the time to add to the starting moment of the scenario. For example, by indicating+2.5the event will take place after 2 hours and 30 minutes from the starting time of the scenario. - Parameter
-
It is the parameter name expressed in the form "object type.object name.property" (e.g.,
GDEM.CGS_01.QSETfor a gas external). - Value
-
It is a numeric value to be used. This has to be empty for certain events.
- Unit
-
It is the unit of measure in square brackets. This has to be empty for certain events. Accepted values are limited to the ones reported in the sheet UNITINFO of the template or of the Lexicon (see file
Lexicon.xlsxunder theDocumentationfolder in the SAInt directory). - ProfileName
-
The name of the profile to be used for the event. When no profile is used, leave the field empty. If the profile is not available in the scenario, the event is dropped.
- Condition
-
The condition for the event. When no condition is used, leave the field empty. If a condition has a wrong syntax the event is dropped.
- EvaluationType
-
The evaluation criterion, if a condition is present. If the criterion has a wrong syntax, the event is dropped.
- UsePrfStartTime
-
A Boolean value to indicate if the profile time defined for the event should be used instead of the global profile start time defined for the scenario.
- PrfStartTime
-
Define the start time and date of the profile. The time must be expressed using an absolute format like dd/MM/yyyy HH:mm.
- AveragePrf
-
A Boolean value to specify if profile values should be averaged over the scenario time step.
- InterpolatePrf
-
A Boolean value to indicate if interpolation should be performed between two steps of a profile.
- Active
-
Boolean value to describe the state of the event.
- Info
-
A text field to add extra user information.
The Excel file Template_GSCE.xlsx is designed to create a gas scenario. The same GSCE is used for all the gas scenario types (SteadyGas, DynamicGas). Its content is the same as the one for an electric scenario.
|
Object ID must be aligned between the network and the scenario. Otherwise, the object event won’t be imported successfully (warning messages are provided). |
|
4. Shapefile templates for GIS data
The fastest and most efficient way to import in SAInt data available in a geographic information system is to use the templates in shapefile format.
Templates for pipelines and externals in gas networks are provided in shapefile format in the directory Shapefile\Gas in DataImport. The files Gas_Pipelines.shp, Gas_Pipelines.dbf, and Gas_Pipelines.shx constitute a shapefile container for pipeline objects. The files Gas_Nodes_XXX.shp, Gas_Nodes_XXX.dbf, and Gas_Nodes_XXX.shx constitute a shapefile container for externals, and all other linear objects. A shapefile container is provided for each different object in a gas network. The _XXX part in the name indicates the type of object, like, for example, Gas_Nodes_GCS.shp stands for the compressor stations (GCS).
Templates for electric lines, transformers, and externals in electric networks are provided in shapefile format in the directory Shapefile\Electric in DataImport. The files Electric_lines.shp, Electric_lines.dbf, and Electric_lines.shx constitute a shapefile container for electric line objects. The files Electric_Nodes_XXX.shp, Electric_Nodes_XXX.dbf, and Electric_Nodes_XXX.shx constitute a shapefile container for nodes and externals, and all other linear objects. A shapefile container is provided for each different object in an electric network. The _XXX part in the name indicates the type of object, like, for example, Electric_Nodes_EDEM.shp stands for externals for an electric demand (EDEM).
Templates for pipelines and externals in thermal networks are provided in shapefile format in the directory Shapefile\Thermal in DataImport. The files Thermal_Pipelines.shp, Thermal_Pipelines.dbf, and Thermal_Pipelines.shx constitute a shapefile container for pipeline objects. The files Thermal_Nodes_XXX.shp, Thermal_Nodes_XXX.dbf, and Thermal_Nodes_XXX.shx constitute a shapefile container for externals. A shapefile container is provided for each different object in a thermal network. The _XXX part in the name indicates the type of object, like, for example, Thermal_Nodes_HSUP.shp stands for the heat supply externals (HSUP).
The templates contain mock examples for all different types of branches, externals, and their properties. The column’s name in the attribute table matches the corresponding property name in SAInt. In a few cases, the name has been shortened due to the limitation to 10 characters of the DBF format. The templates have no coordinate system defined. Each numerical property in SAInt is associated with two columns in the DBF table of the shapefile. The first column is for the numeric value. The second column allows the user to record the unit of measure used to represent the numerical value. The name of this second column ends with 'u' for the unit. SAInt does not use this column.
For a step-by-step description of how to import generic shapefiles in SAInt refer to the How-To "Import Network Data in Shapefile Format".
|
The templates assume the use of a specific data model. Pipelines and electric lines are the only objects represented using polylines. All other objects in all network types must be represented by points. SAInt will convert point geometry describing linear objects. |
5. Wind turbine power curve template files
Wind turbine power curves (WTPC) can be imported into SAInt by single-sheet text format files. The WTPC import file can only be imported if an electric network is active in SAInt. These templates are saved in .\DataImport\WindTurbinePowerCurve. A template can be easily customized for models that are not present in SAInt’s database.
A template is composed of three sections: the [UNIT] section, the [DEF]`section, and the `[DATA] section. In the [UNIT] section, the user lists the variables of the curve and the associated units of measures. In the [DEF]`section, the user specify which class of mathematical relationship links the variables (generally a `Linear class). Finally, in the [DATA] section, the user lists the values of the variables for building the relationship.
Multiple curves could be saved in the same text file. Each curve must have its row in the [DEF] section, and values in the [DATA] section, with the name of the curve next to the label [DATA].
Please, note that in the following example, the sequence "->" represents a TAB. A line starting with % indicates a comment.
Example of the structure of a Wind turbine power curve file:
%Import template for Power Curve of Wind Turbine,
[UNIT]
VEL -> [m/s]
PPOW -> [kW]
[DEF]
%WindTurbineCurveName -> InterpolationType=0
example -> Linear
[DATA] -> example
%Wind Speed [m/s] -> TurbinePowerOutput [kW]
0 -> 0
3.75 -> 0
4 -> 28.5
4.25 -> 46.875
4.5 -> 65.25
4.75 -> 83.625
5 -> 102
... -> ...
39.75 -> 0
40 -> 0
6. Fuel consumption curve template files
Fuel consumption curves (FCC) can be imported into SAInt by single-sheet text format files. The FCC import file can only be imported if an electric network is active in SAInt. These templates are saved in .\DataImport\FuelConsumptionCurve. The user can easily customize the template to model new curves.
A template is composed of one main section and possible comment lines. The main section starts with the [DATA] filed followed by the name of the curve. Spaces must be avoided in names. The following line reports the part where units of measurement are defined for power and fuel consumption between square brackets. The last part of the section is defining couples of values for describing the curve. The first and last couple must start with PMIN and PMAX. In this way the curve has clear boundaries.
Multiple curves could be saved in the same text file. Each curve must have its [DATA] section and values.
Please, note that in the following example, the sequence "->" represents a TAB. A line starting with % indicates a comment.
Example of the structure of a fuel consumption power curve file:
%Import template for Fuel Consumption Curve of a Fuel Generator
[DATA] -> Profile_Name
P [MW] -> FC [FuelUnit/h]
PMIN -> 28492951415
20.33 -> 90043041695
30.66 -> 186058425308.393
PMAX -> 316539102255.06
7. Gas quality template file
In the directory .\DataImport\Quality the user can find two other resources. The file DataProviderURL.txt lists the URL of the weather resource database provider accessible by SAInt. See "Integrating Weather Resource Data" for a detailed description of the topic.
The gas quality template file is a multi-sheet format file either in Excel or in text file format (e.g., text TAb delimited *.txt files, or text comma separated *.csv files). The Excel file template is the preferred solution, and it is available with the file GasQualityImport.xlsx in .\DataImport\Others. The text file template is the file GasQualityImport.txt.
Its structure mimics closely the one of an Excel template. The [GCMP] section is for gas components, and it starts with a header line describing which properties and units of measure, followed by a new row for each component with the necessary data. The [GQUAL] section is for gas quality streams, and it starts with a header line describing which properties and units of measure, followed by a new row for each gas quality with the necessary data. The last section is [GCUS], where the compositional data for each gas stream are provided. Finally, the user can specify the units of measure used in the template either by introducing a dedicated section [UNIT] or by indicating the units in the header row. If both options are used, the units specified in the header row is the one used.
Please, note that when a property is calculated by SAInt or is derived by the build-in SAInt database, its place in the template is empty. In the following example, we have one gas component (i.e., neon) and three gas qualities (i.e., default, Groningen and Qatar). Units of measure as specified in both the [UNIT] section and in the header row. For TC values will be interpreted as Celsius degrees. The sequence "->" represents a TAB. A line starting with % indicates a comment.
Example of the structure of the text format template for gas quality:
% Quality named "Default" will be added as default quality to the Gas network
% If no gas properties are defined then the properties will be computed from the specified gas composition
% pressure unit should be defined as absolute pressure
[UNIT]
CV->[MJ/sm3]
P ->[MPa]
T ->[K]

[GQUAL]
Name -> RHOr[-] -> GCV[MJ/sm3] -> NCV[MJ/sm3] -> PC[bar] -> TC[C]
Default
Groningen -> .56 -> -> -> 4.5 -> 192
Qatar

[GCMP]
Name -> RHOr[-] -> GCV[MJ/sm3] -> NCV[MJ/sm3] -> ShortName -> PC[bar] -> TC[C]
Neon

[QUAL] -> GRONINGEN
%Methane
C1 -> 75
%Nitrogen
N2 -> 10
%Carbon Dioxide
CO2 -> 5
%Ethane
C2 -> 5
%Propane
C3 -> 0
%iso-Butane
IC4 -> 0
%n-Butane
NC4 -> 0
%iso-Pentane
IC5 -> 0
%n-Pentane
NC5 -> 2
%n-Hexane
NC6 -> 0
%n-Heptane
NC7 -> 0
%n-Octane
NC8 -> 0
%n-Nonane
NC9 -> 0
%n-Decane
NC10 -> 0
%Hydrogen
H2 -> 3
%Oxygen
O2 -> 0
%Carbon Monoxide
CO -> 1
%Water
H2O -> 1
%Hydrogen Sulfide
H2S -> 0
%Helium
HE -> 0
%Argon
AR -> 0
[QUAL] -> QATAR
C1 -> 92.0
CO2 -> 3.5
N2 -> 1.5
Neon -> 3
[QUAL] -> Default
C1 -> 80
C2 -> 5
N2 -> 10
H2 -> 3
CO2 -> 2
8. CEM input data
In the directory .\DataImport\Template, the user can find the Python script run_cem.py, which can be personalized to run a CEM optimization from the SAInt API and the folder Input collecting comma-separated files (CSV) for specifying different aspects of a CEM model. The CSV files cover:
-
the list of investment years with their temporal resolution for operational modeling.
-
the scenario properties that control the CEM algorithm and solution process.
-
the input properties for specific objects in the model.
-
the events to change property values across different investment years.
-
the time series input data and representative periods.
-
the mapping of the representative periods to operational time steps.
-
the selection of the scalar output properties to be written to the output files.
-
the selection of the time series output properties to be written to the output files.
9. Other resources
In the directory .\DataImport\Others, the user can find the file DataProviderURL.txt. This file lists the URL of the weather resource database provider accessible by SAInt. See "Integrating Weather Resource Data" for a detailed description of the topic.