Graphical User Interface
SAInt has a modern, rich, and flexible "graphical user interface" (GUI). The GUI can be used to create, edit, execute, and analyze networks and scenarios. It allows to import and export data in different formats. Through the GUI, it is possible to interact with the SAInt core module suing a command line or by IronPython scripts.
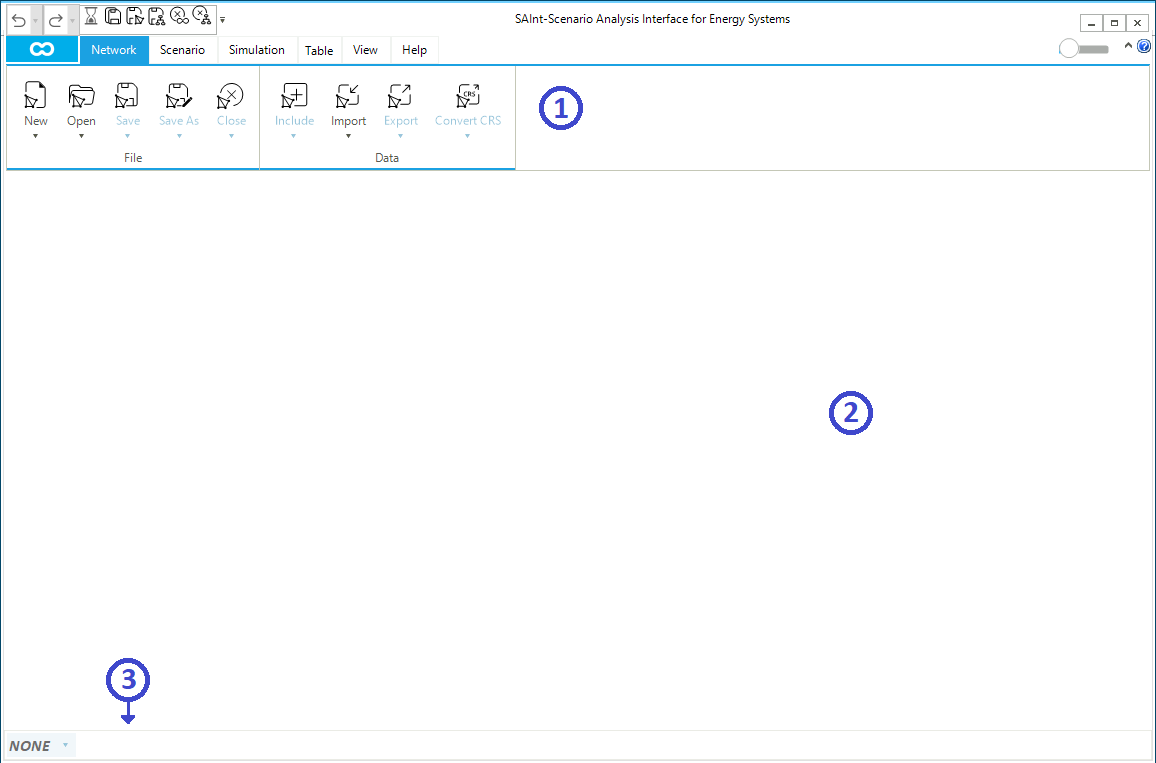
The SAInt-GUI contains three main control elements: ribbon bar, dock panel, and status bar, as shown in Figure 1. The ribbon bar contains the main entries to SAInt’s functionalities by either menus or buttons. The doc panel is the space where SAInt places and manages all the different windows used to visualize and interact with objects, properties, simulations/optimizations, and results. The status bar describes the active project, network, scenario, and the status of the simulation/optimization.
The following sections describe in detail the different parts of the graphical user interface and their sub-elements. Figure 2 provides a schematic view of the hierarchy of the GUI components and shows the parent-child relationship among elements.