Customer Support and Services
1. SAInt Documentation
SAInt’s documentation is organized into four sections. The "Reference Guide" navigates the user through the interface and functionalities of the GUI and API. The "How-to Guides" offers instructions to achieve specific tasks. The "Tutorials" section shows, using a case study approach, how to address modeling simulations or optimizations of networks. Finally, the "Learn-More" section dives into the theory and mathematical details, describing modeling choices, logic, and software standards. The user can access SAInt documentation in two ways: 1) through a local copy, which is downloaded during the installation process of SAInt, and 2) a regularly updated, cloud-based version found on the encoord Doc’s webpage. The documentation can be navigated by using either the table of contents on the left (general) or right (section specific), or by searching a specific term using the integrated search engine.
1.1. Reference Guide
The "Reference Guide" explains how the software is organized, which functionalities and settings are available, and where to find them. It describes the GUI and the API and introduces a set of typographical conventions to recognize objects, concepts, and properties. The Reference Guide starts with an overview of the software’s architecture (As described in section 1.2 in this document). The most significant part of the Reference Guide is dedicated to a presentation of the GUI, with subsections dedicated to the ribbon bar, the dock panel, and the status bar. In the "Objects" chapter, all modeled objects in SAInt are described, along with their properties, relationships, set of events, and basic and derived results. In the "Scenario" chapter, each simulation or optimization strategy is presented based on the type of network the user needs to model. The "Data Exchange" chapter discusses the capabilities of SAInt to import or export model data or results from and to different formats, like Microsoft Excel™, comma-separated values (CSV) tables, or shapefiles for geographic data, utilizing templates. The chapter "Functions, Expressions and Conditions" uses examples and charts to detail how to use the built-in IronPython scripting capabilities to create customized plots and tables, carry out calculations on results, or implement conditional statements for a "what-if logic" in the simulation. Finally, the Reference Guide covers the use, calls, and methods available in the API using examples and snippets of reusable code. The local copy of the "Reference Guide" can be accessed at any moment from SAInt by using the keyboard shortcut F1. When a user hovers over an icon, object, or section of the GUI and presses F1, they will be redirected to the relevant section for that element.
1.2. How-to Guides
The "How-to Guides" section of SAInt documentation is designed to support a user’s daily activities. Each How-to Guide addresses a specific and well-defined set of steps guiding the user from one point to another. How-to Guides cover the most frequent tasks and actions a user performs in SAInt and is divided into five different sub-sections, including "Generic", "Electricity Markets", "Gas Networks", "Electricity Networks" and "Combined". The "Generic" sub-section of the How-to Guides covers actions like defining a network, creating a scenario, editing the topology, or importing data from external data sources. The how-to guides in the Electricity Markets section address actions such as outage periods, transmission losses, or flexible demand. The "Gas Networks" section provides step-by-step instructions for actions like creating and editing new gas objects in a network, creating and editing a gas component, and importing and exporting gas qualities. The "Electricity Networks" sub-section covers topics like adding new facilities or fuel types, retrieving wind turbine data, connecting to meteorological data providers, or adding ancillary services. The "Combined" sub-section contains how-to guides showing the sequence of steps to create a hub system and facility. The "How-to Guides" are recommended for users new to SAInt or would like a refresher on certain topics in SAInt.
1.3. Tutorials
The "Tutorials" section of SAInt’s documentation provides step-by-step actions on how to use SAInt in real-world industry case studies. SAInt’s advanced functionalities and tools are explored, along with examples of advanced charting, results post-processing, and scenario assessment. The Tutorial section is for users who want to broaden their knowledge of the software, take full advantage of its flexibility, and find better solutions to complex problems. Tutorials engage the user in a self-guided set of step-by-step exercises. They are recommended for any user who prefers a self-paced and self-taught training plan to deepen the understanding of how to address energy systems models practically. As with any other part of SAInt’s documentation, they are constantly under revision and extended to new cases. The available list of tutorials is:
-
Energy Markets
-
Fundamentals of Direct Current Unit Commitment Optimal Power Flow (DCUCOPF) Scenarios
-
Analyze an Electricity Market Optimization Model
-
Model Electricity Storage, Solar, and Wind Production in a Production Cost Model
-
Setting up an Electric Storage in a DCUCOPF Scenario
-
Set up New Custom Constraint Objects in a PCM
-
-
Electricity Networks
-
Steady State and Quasi-Dynamic Alternating Current Power Flow (ACPF) Simulation
-
Analyze an Alternating Current Power Flow (ACPF) Simulation
-
High Voltage and Medium Voltage ACPF Simulation
-
-
Gas Networks
-
Transmission System Steady State and Dynamic Simulation
-
Analyze a Transmission System Dynamic Model
-
Contingencies and Hydrogen Blending in Transmission Systems
-
-
Thermal Networks
-
Steady State and Quasi-Dynamic Thermal Simulation
-
-
Coupled Networks
-
Feedback in Combined Dynamic Gas and Electricity Networks
-
-
Capacity Expansion Modeling
-
Fundamentals of Capacity Expansion Modeling (CEM) Scenarios
-
-
Scripting
-
API Beginner
-
API Advanced
-
Plugin Beginner
-
1.4. Learn More
Users can further their technical knowledge of SAInt in the "Learn More" section of SAInt’s documentation. The "Learn More" section provides a mathematical explanation of how SAInt represents and describes objects used in building energy systems. The Learn More section is recommended for the SAInt user interested in learning more about how SAInt operates and how SAInt can be used to solve problems.
2. Technical Support & Training
encoord provides comprehensive customer support for SAInt. Many times, the complexity of the tasks performed in SAInt requires guidance and support from experienced modelers and software engineers. Therefore, the subscription to SAInt always includes a customer support service through email or phone communication for the entire subscription term.
As a relatively new software solution on the market, SAInt undergoes continuous improvements by our modelers and software engineers. Additional features and simulation models are being developed and will be added successively to future releases. We want our customers to benefit most from these advancements, therefore, we offer our maintenance and update services in all our subscription packages.
Our software training is conducted by experienced engineers who have several years of training experience. Our aim is not only to teach the use of our software, but also to train our clients to better understand the operation and interdependency of energy systems and how those interdependencies are reflected by the mathematical models implemented in SAInt. We believe this is crucial for our clients to be able to interpret the simulation results correctly. Trainings are offered in person at our offices or at the premises of our customers.
3. Data Provider Integration
SAInt connects to several weather resource data providers, which allows the creation of high-resolution wind and solar power time series for different plant designs and locations where weather resource data are available.
3.1. Solar Weather Data
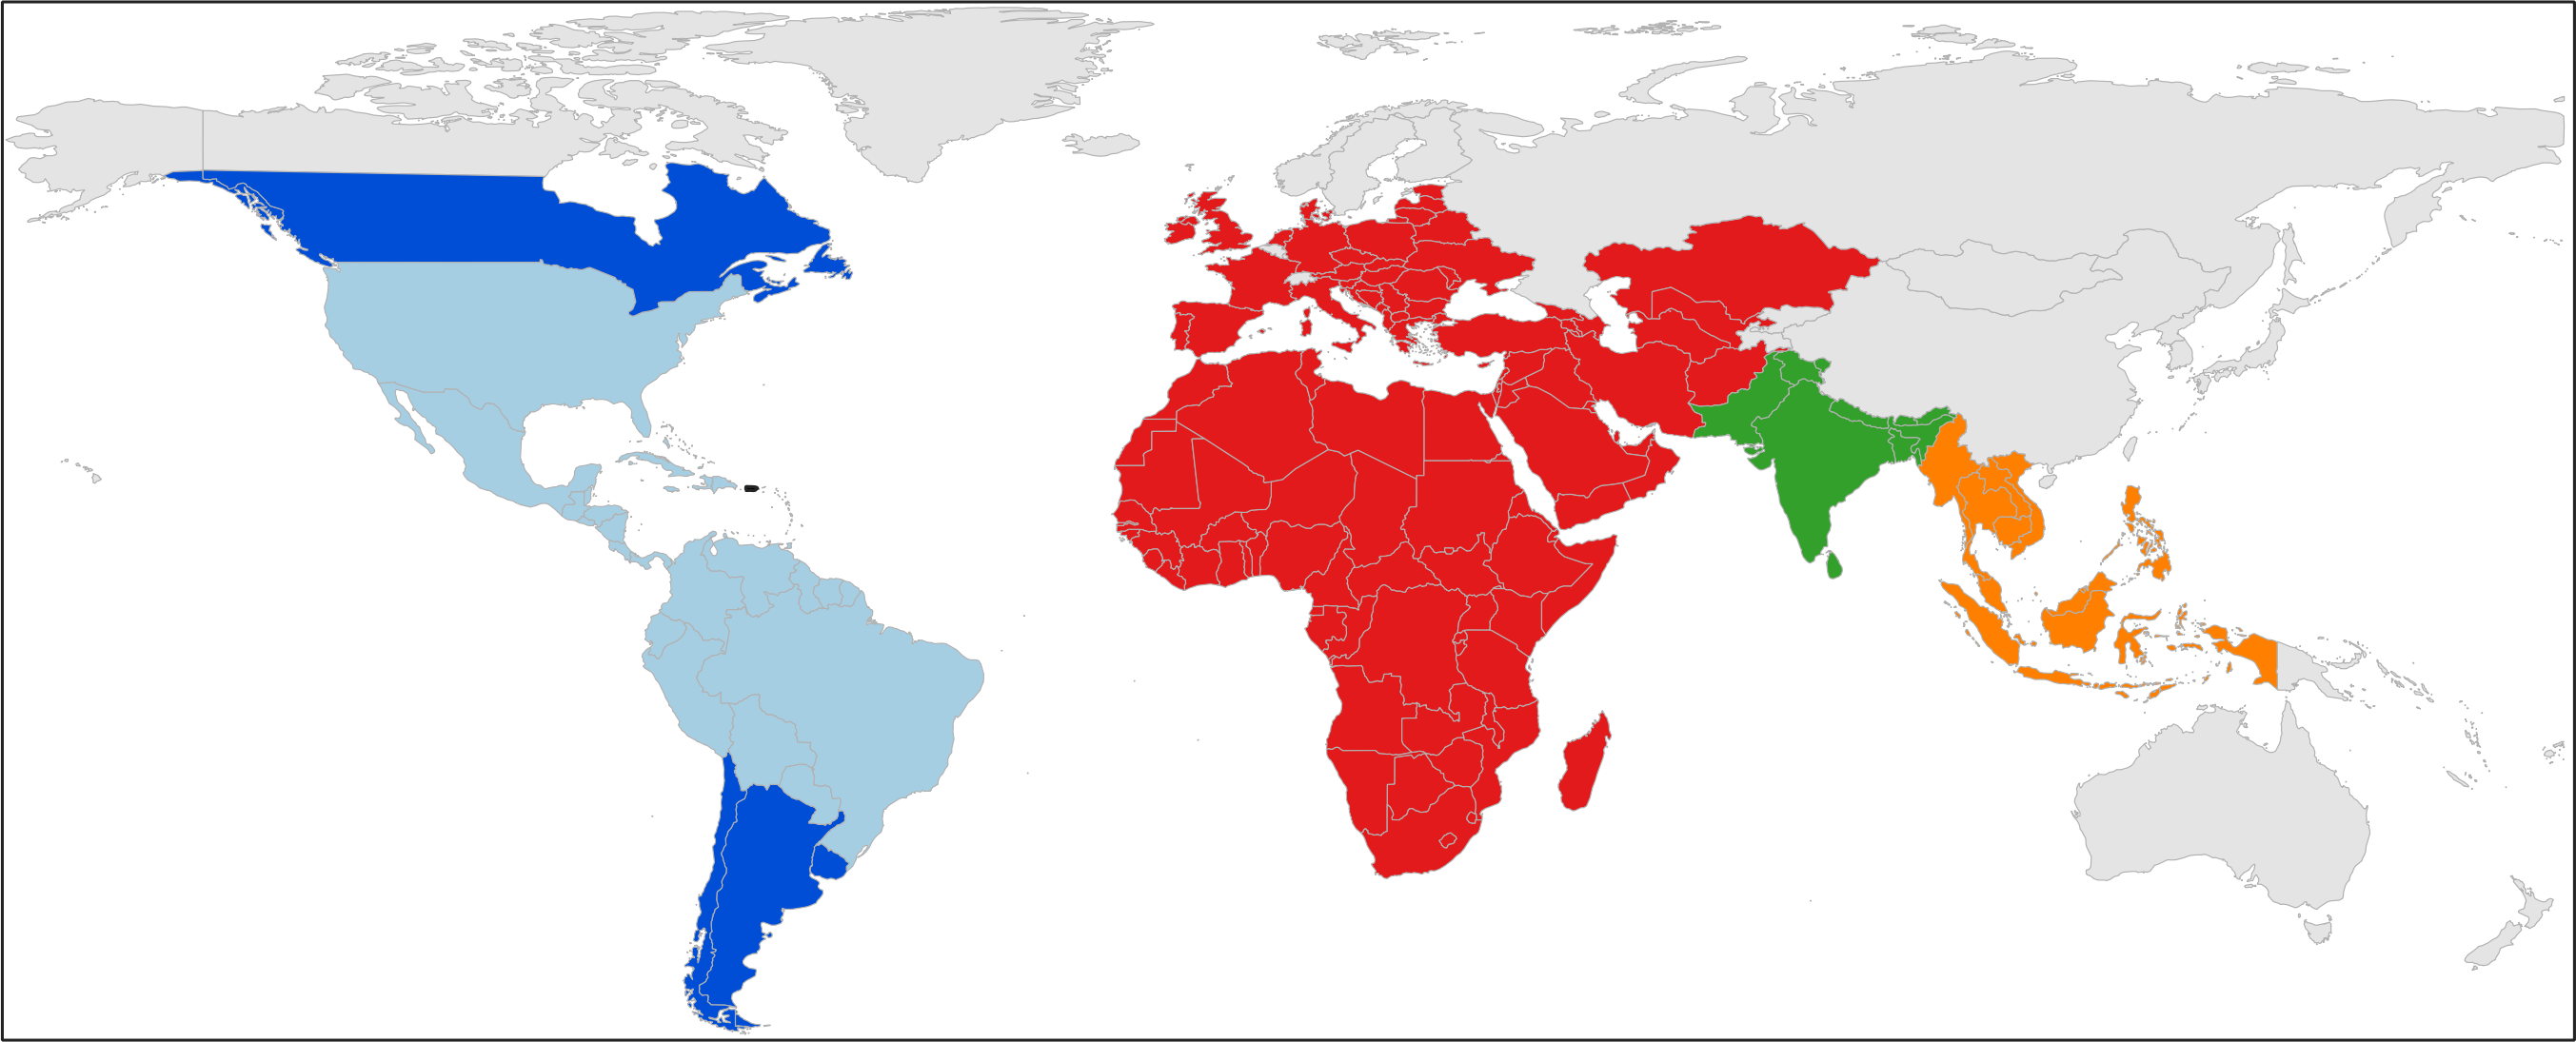
The current solar weather resource data providers integrated into SAInt are the National Solar Radiation Database (NSRDB), owned and maintained by the National Renewable Energy Laboratory (NREL), and the Photovoltaic Geographical Information System (PVGIS), managed by the Joint Research Centre of the European Commission. The database allows users to collect solar weather resource data into SAInt from around the world (Figure 1). Through solar weather resource data, users can access global horizontal irradiance (GHI), direct normal irradiance (DNI), diffuse horizontal irradiance (DHI), air temperature, and wind speed.
Figure 1 and Table 1 describe the solar geographical coverage across the globe. SAInt uses the PVWatts (no financial model) of the System Advisor Model (SAM) developed by NREL to calculate solar PV generation profiles. SAM is a techno-economic model designed to facilitate decision-making for people in the renewable energy industry. This model generates time series data representing solar electricity production for each PV object over a year. The generated profile timestep depends on the weather data’s temporal resolution and inputs describing the system’s nameplate capacity, array orientation, mounting type, system losses, etc.
| Data Provider | Weather Year(s) | Temporal Resolution | Spatial Resolution | Coverage Area (Color) |
|---|---|---|---|---|
2018 - 2024 |
10, 30, 60 minutes |
2 km x 2 km |
Dark and Light Blue |
|
1998 - 2024 |
30, 60 minutes |
4 km x 4 km |
Light Blue |
|
2018 - 2024 |
5, 15, 30, 60 minutes |
4 km x 4 km |
Light Blue |
|
2017 - 2019 |
15, 30, 60 minutes |
4 km x 4 km |
Red |
|
2000 - 2014 |
60 minutes |
10 km x 10 km |
Green |
|
2011 - 2015 |
30, 60 minutes |
4 km x 4 km |
Orange |
|
2016 - 2020 |
10, 30, 60 minutes |
2 km x 2 km |
Orange |
|
2022 - 2024 |
60 minutes |
4 km x 4 km |
-* |
|
2005 - 2023 |
60 minutes |
4 km x 4 km, 5 km x 5 km, 25 km x 25 km |
latitude 60°S - 74°N |
3.2. Wind Weather Data
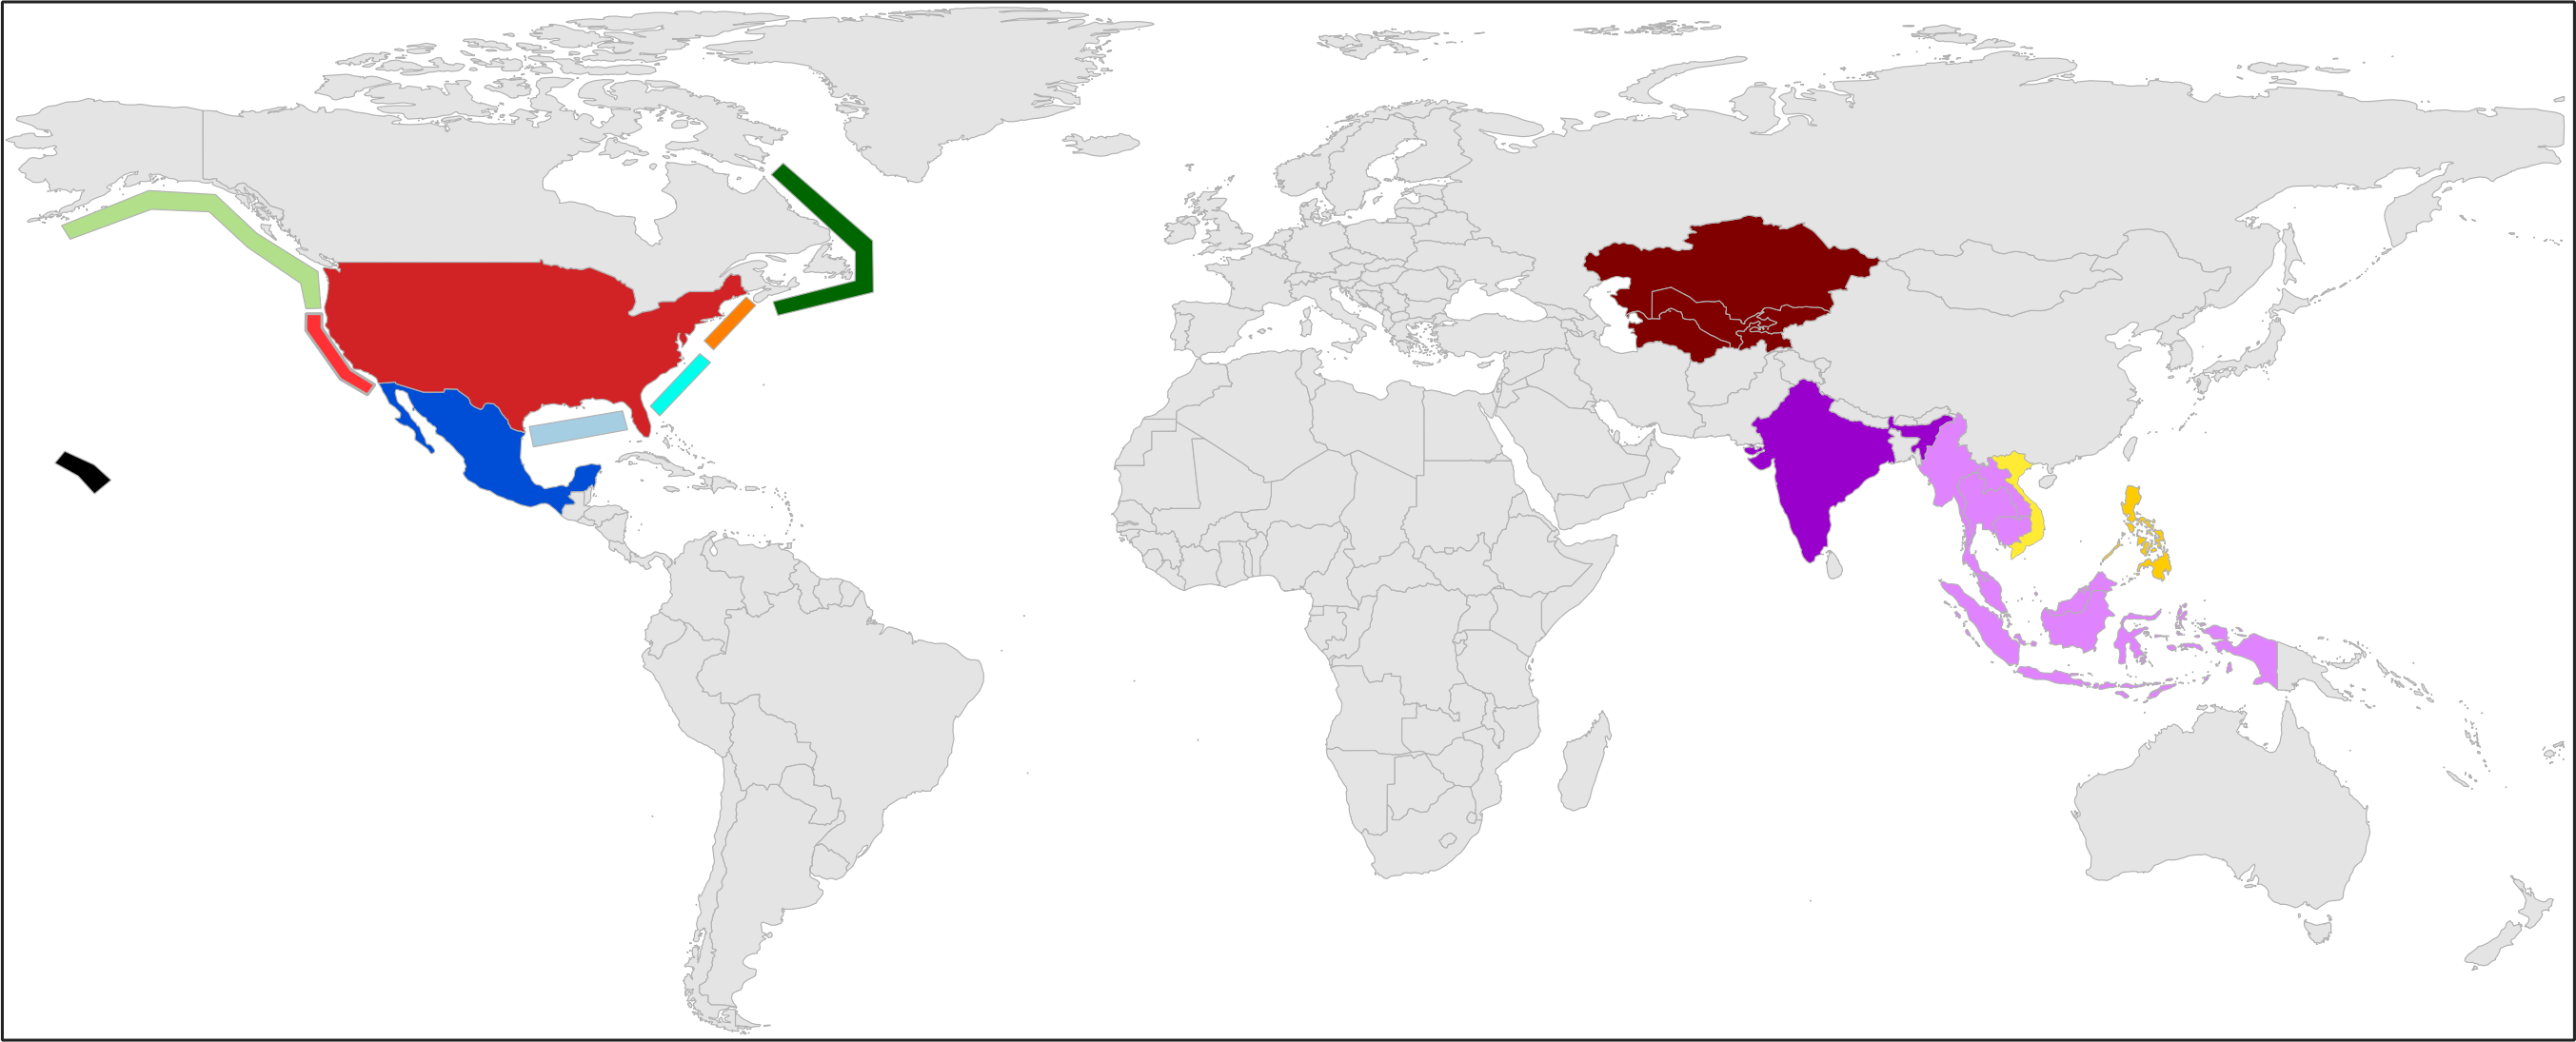
The WIND Toolkit is owned and maintained by NREL. SAInt has a built-in wind power performance model to calculate a wind power plant’s power generation time series. The database allows users to collect wind weather resource data into SAInt from around the world (Figure 2). Through wind weather resource data, users can access wind speed, wind direction, air pressure, and air temperature at different locations and heights.
Figure 2 and Table 2 describe the wind geographical coverage across the globe. SAInt has a built-in wind power performance model to calculate a wind power plant’s power generation time series. The generated profile time step depends on the weather data’s temporal resolution and inputs describing the system’s nameplate capacity, wind turbine power curve, system losses, etc. This model generates time series data representing wind electricity production for each WIND object over a year. The installation folder gives the user a database of over 200 wind turbine power curves based on commercial data from over 40 manufacturers.
| Data Provider | Weather Year(s) | Temporal Resolution | Coverage Area (Color) |
|---|---|---|---|
2007 - 2014 |
5, 15, 30, 60 minutes |
Dark Blue |
|
2014 |
15, 60 minutes |
Dark Purple |
|
2015 |
15, 30, 60 minutes |
Dark Brown |
|
2000 - 2020 |
5, 15, 30, 60 minutes |
Light Red |
|
2000 - 2020 |
5, 15, 30, 60 minutes |
Orange |
|
2000 - 2020 |
5, 15, 30, 60 minutes |
Black |
|
2017 |
60 minutes |
Dark Yellow |
|
2016 |
60 minutes |
Light Yellow |
|
2007 - 2014 |
5, 15, 30, 60 minutes |
Dark Red |
|
2000 - 2020 |
5, 15, 30, 60 minutes |
Light Blue |
|
2000 - 2020 |
5, 15, 30, 60 minutes |
Cyan |
|
2000 - 2019 |
5, 15, 30, 60 minutes |
Light Green |
|
2000 - 2020 |
5, 15, 30, 60 minutes |
Dark Green |
|
2017 - 2021 |
15, 30, 60 minutes |
Light Purple |
|
2009 - 2017 |
15, 30, 60 minutes |
Dark Red (only for the state) |
|
2009 - 2017 |
5, 15, 30, 60 minutes |
Cyan/Light Blue |
|
2016 - 2021 |
15, 30, 60 minutes |
Light Purple |
|
2015 - 2023 |
60 minutes |
- * |
4. Model-ready Datasets
Model-ready Datasets (MRDs) are datasets ready to be used in SAInt. There are two types of MRDs: non-commercial and commercial. Commercial MRDs are curated and managed by encoord and available for purchase for clients with a SAInt license.
4.1. Non-commercial Model-ready Datasets
Non-commercial MRDs are available in the "SAInt community forum". They could be curated either by encoord or by members of the community. Two examples of non-commercial MDRs are:
-
ENET39: The ENET39 network is a modified version of the IEEE 39-bus Test System, representing the network of the New England region in the United States (10.1109/ISGTAsia54193.2022.10003588). The network is on a 100 MVA base and the network voltage level is 20-345 kV. The model comprises of 39 nodes (buses), 34 electrical lines, 12 transformers, 19 demands (with the peak power equal to 6.125 GW) and a fleet of 19 generator for different technologies.
-
ENET138: The ENET138 network is an adaptation of the "IEEE-123 Bus distribution test system", enhanced with a sub-transmission network. The model comprises of 138 nodes (buses), 132 electrical lines, and 6 transformers. The sub-transmission was created with a per length 34.5 kV ground Wye conductor path with a variety of demands spread across the almost entirely radial network. The distribution network is connected on the low voltage side of 34.5 kV / 4.16 kV substation transformer. The ENET138 network is composed of 109 demand objects with a peak power demand of 5.3 MW. The generation includes 17 distributed PV systems installed at various nodes within the distribution network.
4.2. Commercial Model-ready Datasets
Commercial MRDs can be purchased by the SAInt user. encoord can develop ad hoc electric, gas, thermal, and combined models upon request. The available commercial MRDs are:
-
European Zonal Electricity Market: The model allows the execution of production cost model scenarios (DCUCOPF) of 1 year with an hourly resolution. The model has been developed using the data collected from the European Network of Transmission System Operators for Electricity (ENTSOe) and additional sources. The model has been benchmarked against ENTSOe in terms of generation, power not served, and flow distribution. The model has 46 bidding zones, 44 demands, 86 interconnections, and 2453 generators separated into 18 production types (solar, wind onshore, wind offshore, biomass, geothermal, other renewable, waste, other, run-of-river, hydro water reservoir, pumped storage, natural gas, oil, hard coal, oil shale, peat, lignite, and uranium).
-
United States Zonal Electricity Market: The model allows the execution of production cost model scenarios (DCUCOPF) of 1 year with an hourly resolution. The model has 11 zones (CAISO, MISO, ERCOT, PJM, etc.), 134 nodes, 134 demands, 310 interconnections, 75 storages, and 9270 generators separated by multiple production types.
-
Indian Zonal Electricity Market: The model allows the execution of production cost model scenarios (DCUCOPF) of 1 year with an hourly resolution. The model has been developed and benchmarked against the Regional Energy Deployment System (ReEDS) Indian model in terms of generation, power not served, and flow distribution. The model has 34 bidding zones, 34 demands, 70 interconnections, and 1067 generators separated into different production types (solar, wind, hydro run-of-river, coal, lignite, oil, diesel, natural gas, bagasse, and uranium fuel generators).
5. pySAInt - A Powerful Data Management Tool
pySAInt is a data management tool designed to help SAInt users create, organize, and/or edit their SAInt datasets using python. It contains a lightweight "clone" of the SAInt object model including networks, objects, scenarios, profiles, and events. With pySAInt, users can easily define these components and how they relate to one another as an energy model to be used in SAInt. pySAInt users can easily export their datasets in Excel format ready to be imported into the SAInt software. pySAInt also streamlines connecting to the SAInt API from python and there also includes some limited support for writing results from SAInt to csv files.
pySAInt is supplemental to SAInt and is not designed to replace SAInt in any way. pySAInt is intended to be a "sandbox" in which experienced users of SAInt with some python programming experience can automate/streamline their use of SAInt. Users should always refer to information directly from SAInt - including modeling results, log files, and other messages - for confirmation that their modeling work with SAInt is implemented as they intended. Liability for understanding how pySAInt can be leveraged to use SAInt properly is the sole responsibility of the user.
pySAInt is provided "as is" to help experienced users of SAInt in their workflow. Support for pySAInt may be provided on a limited basis as needed, including version updates corresponding to public releases of SAInt and bug fixes for any critical bugs users may find in the tool. pySAInt users may request additional features and provide other feedback about the tool, but encoord assumes no obligation to expand the functionality of the tool.
6. Plugins
A plugin is an external self-contained executable software component that adds new features or specialized functionality to SAInt without altering its core code. It acts as an extension, enabling users to customize and enhance the application to meet specific needs. It is more than a script, because it not only allows to accomplish a set of complex operations, but it also has a graphical user interface and a larger codebase.
Examples of plugins are:
-
"ACPF Contingency Analysis": A simple plugin to do AC power flow contingency analysis.
-
"Dot raw to SAInt Translation": A simple plugin that translates power system data from .raw files to SAInt format. PSS®E is one of the industry standard power flow simulation tools. There is support for PSS®E .raw files to be converted directly to the SAInt *.enet file format, supporting all the core power flow functionality, from off-nominal turns ratios with transformers to automatic tap control and switched shunt behavior.
Publicly available plugins can be retrieved from the community Forum under the category "Plugins".
7. Data Importing Tools
In order for SAInt to read network data files, the data needs to be in a certain format (.enet/.gnet/.tnet files). Considering the user likely does not have the data they would like to analyze in the SAInt file format, the development of new, or existing, networks in the SAInt framework can be a long and challenging process. To this aim, the encoord team has developed translation tools that convert other common data types for electric and gas networks into the SAInt framework. While a few of the translations require the use of an external Python engine, others are integrated into the backend of SAInt.
7.1. Synergi Gas to SAInt
Synergi gas is a hydraulic modeling simulation tool. SAInt provides a conversion tool that supports importing and converting Synergi Gas models to SAInt gas networks and scenarios. The objects from the Synergi model are converted to the SAInt object types using as much of the original data as possible. Benchmarking between SAInt and Synergi gas has been verified on many test networks and physical systems. The tool will utilize default properties if data is unavailable. This conversion tool is integrated into the SAInt software and requires no additional software or installations.
7.2. CYME to SAInt
CYME is an industry-standard distribution simulation tool. SAInt is capable of receiving CYME datasets and converting them in a one-to-one manner to SAInt objects, and applying the UACPF scenario type to arrive at the unbalanced power flow results. This translation has been validated to ensure the power flow results between the tools are identical. With this conversion, CYME users can immediately convert to the SAInt data framework and continue working on their models with the additional features that SAInt provides. This translation tool is not integrated into SAInt but provides an easy-to-use Python script.
7.3. OpenDSS to SAInt
OpenDSS is an open-source distribution tool that is used by researchers and utility owners. The OpenDSS data can be directly translated to the SAInt data framework for use in the UACPF scenario. This translation tool is not integrated into SAInt but provides an easy-to-use Python script.